Download
1 / 45
450 likes | 609 Views
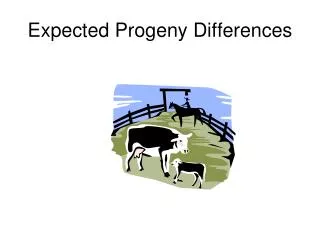
More Dependable Bull Buying with Genomic-Enhanced Expected Progeny Differences (GE-EPDs). Sire selection drives the genetic component of commercial production. Benefit of GE-EPDs: More Profitable Bull Buying from More Accurate & Complete Information. What are EPDs?. Consider Two Angus Sires.

E N D
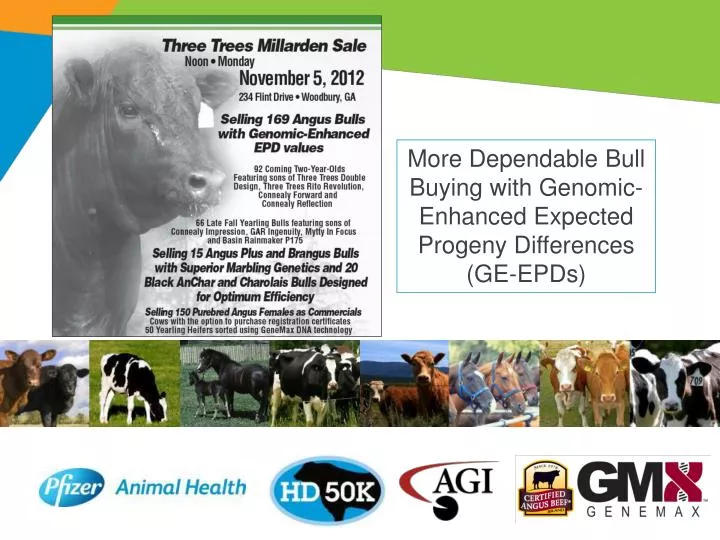
More Dependable Bull Buying with Genomic-Enhanced Expected Progeny Differences (GE-EPDs)
Sire selection drives the genetic component of commercial production Benefit of GE-EPDs: More Profitable Bull Buying from More Accurate & Complete Information
What are EPDs? Consider Two Angus Sires • Sire A – WW EPD = +55 lbs (top 20% rank - non-parent bulls) • Sire B – WW EPD = +40 lbs (top 80% rank) • Difference in Sire A & B’s EPDs = 15 lbs • Assuming other factors equal, and 25 calves/year for four years: • $2,250 advantage for bull A due to weaning growth • [15 lbs X 100/head X $1.50/cwt = $2,250 ($22.50/head)] • EPDs rank animals and incorporate pedigree, performance and progeny information – young bulls have low accuracy
Preseason SI Top 20 1. Alabama 2. USC 3. LSU 4. Oregon 5. Oklahoma 6. Wisconsin 7. South Carolina 8. Michigan State 9. University of Georgia 10. West Virginia 11. Florida State 12. Arkansas 13. Michigan 14. Clemson 15. Texas 16. Kansas State 17. Stanford 18. Virginia Tech 19. Nebraska 20. Georgia Tech
Preseason SI Top 20 1. Alabama 2. USC 3. LSU 4. Oregon 5. Oklahoma 6. Wisconsin 7. South Carolina 8. Michigan State 9. University of Georgia 10. West Virginia 11. Florida State 12. Arkansas 13. Michigan 14. Clemson 15. Texas 16. Kansas State 17. Stanford 18. Virginia Tech 19. Nebraska 20. Georgia Tech
Preseason SI Top 20 1. Alabama 2. USC 3. LSU 4. Oregon 5. Oklahoma 6. Wisconsin 7. South Carolina 8. Michigan State 9. University of Georgia 10. West Virginia 11. Florida State 12. Arkansas 13. Michigan 14. Clemson 15. Texas 16. Kansas State 17. Stanford 18. Virginia Tech 19. Nebraska 20. Georgia Tech
Preseason SI Top 20 1. Alabama 2. USC 3. LSU 4. Oregon 5. Oklahoma 6. Wisconsin 7. South Carolina 8. Michigan State 9. University of Georgia 10. West Virginia 11. Florida State 12. Arkansas 13. Michigan 14. Clemson 15. Texas 16. Kansas State 17. Stanford 18. Virginia Tech 19. Nebraska 20. Georgia Tech • Similar to College Football RANKINGS - • EPDs RANK Animals • Accuracy of EPD RANKS increase as data is integrated into weekly AGI genetic evaluations • HD 50K tested bulls with GE-EPDs have more dependable RANKs
Genomic Predictions Sources of information for EPDs PedigreeInformation Individual Performance Data Progeny Performance Data Time, Money and Opportunity Costs Genomic-Enhanced EPDs, Accuracies and Indexes Powered by HD 50K
Parentage – HD 50K Features of HD 50K Traits – GE-EPDs & Ranks • Calving Ease Direct • Birth Weight • Weaning Weight • Yearling Weight • Dry Matter Intake (RADG) • Residual Feed Intake • Yearling Height • Scrotal Circumference • Docility • Calving Ease Maternal • Milking Ability • Mature Weight • Mature Height • Carcass Weight • Fat Thickness • Ribeye Area • Marbling Score • Tenderness
Angus Beef Value Index ($B) GE-EPD WW GE-EPD PWG GE-EPD CW $B GE-EPDFAT GE-EPD REA GE EPD MARB
Angus Multi-trait Economic Selection Indexes Simplify Selection Economic indexes combine genetic and economic (revenue and expense) information GE-EPDs Powered by HD 50K increase the dependability of dollar indexes $W (Weaned Calf Value) Combined Genetic Merit for: Birth Weight Weaning Weight Milk Mature Cow Size $W Percent Rank Benchmarks Top 25% > $30 Top 50% > $26 Top 75% > $23 $B (Beef Value) Combined Genetic Merit for: Weaning Weight Yearling Weight Projected Feed Intake Yield Grade (CW, Fat, REA) Quality Grade (Marbling) $B Percent Rank Benchmarks Top 25% > $64 Top 50% > $55 Top 75% > $46
More dependable selection and use of young sire prospects • More accurate and complete selection of young sires • Identify heifer bulls with less risk of calving difficulty • Select sires that produce more problem-free, productive replacements heifers matched to feed and labor resources • More dependable and enabled selection for feedlot growth, feed efficiency and carcass merit
More dependable selection and mating of replacements, cows and donors • More accurate and complete evaluation of females at a younger age • Predictions equivalent to more than a lifetime of natural calf production • Less risk with embryo transfer (ET) through more informed donor selection and mating
Why buy bulls with GE-EPDs powered by HD 50K? To. GE-EPDs reduce risk and economic liablity
Reduced Selection Risk with GE-EPDs Powered by HD 50K Pedigree EPDs EPDs based on pedigree and individual performance
More Dependable Selection with GE-EPDs Powered by HD 50K Pedigree EPDs EPDs based on pedigree and individual performance GE-EPDs powered by HD 50K plus verified pedigree and individual performance GE-EPDs based on initial progeny proof
Application of Actuary Principles to Determine the Value of Added Accuracy from HD 50K
Certified Angus Beef • Established in 1978 as a non-profit subsidiary of the American Angus Association • Global sales of 807 million pounds in 2011 • 65,000 head of cattle required per week to meet demand
Comprehensive Strategies Genetic Improvement is Part of a Complete Plan toEfficiently Produce More High Quality Beef Genetics Nutrition PerformanceTechnology Health Marketing
Product Features GMX™ Score (Combined Gain & Grade Economic Value) GMX™ Marbling GMX™ Gain Sire Match (From nominated HD 50K tested bull battery - optional) $ “Confidential – Pfizer Internal Use Only”
GMX Scores for Marbling, Gain and Economic Value Genomic Predictions Expressed as Scores Associated with Percentile Ranks GMX™ Marbling GMX™ Gain GMX™ Score (Combined Gain & Grade Economic Value)
GMX Reporting Executed by AGI “Confidential – Pfizer Internal Use Only”
Interpreting GMXTM Scores “Confidential – Pfizer Internal Use Only”
GMX Sire Match Sire Match Features • Matches Angus sires to GMX tested animals that were produced from multi-sire breeding groups • Angus sires must be registered, transferred, HD50K tested and nominated as possible sires in order to be matched • Included as a feature of the GMX test at no additional cost • Sire Match may be requested at the same time as GMX testing or after results are received • Not applicable for AAA/AGI parentage verification “Confidential – Pfizer Internal Use Only”
GMX Sire Match Details for Each Nominated Sire Possible GMX Sire Match Outcomes: Most Likely – qualified/best match between sire and offspring GMX markers Other Possible – qualified/ranked possible match, but not most likely Not Likely – improbable due to insufficient concordance of markers Undetermined – HD 50K GMX markers not available “Confidential – Pfizer Internal Use Only”
Target Cattle for Testing Commercial Angus and Angus-influenced (≈ 75%) Females and Feeders sired by registered Angus bulls Commercial Replacement Heifers and Cows • Selection • Mating • Marketing Feeder Cattle • Management • Marketing GMX Not Intended for Use by Seedstock Producers
GMX Efficacy Demonstration Project Data • Approximately 2,000 feedlot steers and heifers • Primarily 50%+ Angus breed composition • GMX tested with individual animal feedlot performance and carcass information • Cattle managed to a consistent compositional endpoint (~0.45 in BF)
GMX Score – Economic Analysis Evaluation Based on Carcass Value Per Day on Feed What is the impact of GMX Score (predicted gain and grade) on expressed change in carcass quantity and quality (value) per day on feed? • Arrival Weight • Average Daily Gain • Harvest Weight • Dressing Percent • Hot Carcass Weight • Quality Grade • Yield Grade • CAB Grid Prices • Projected Days on Feed • Consumption “Confidential – Pfizer Internal Use Only”
Economic Impacts Cattle with higher GMX Scores are associated with greater value to feeders. Value increases with larger differences in GMX Score, lighter start weights and longer days on feed. “Confidential – Pfizer Internal Use Only”
GMX Score Value Simplified 50 units of GMX Score equates to $33/head difference in value from gain, grade and associated traits, or $5.50/cwt in feeder value, $2.50/cwt in live fed cattle value, or $4.00/cwt difference in carcass value Assumptions/Projections: Starting Weight: 600, Days on Feed: 200, End Weight: 1,300 “Confidential – Pfizer Internal Use Only”
GMX Value Estimator Estimates value based on carcass value per days on feed (DOF) User defines difference in GMX Score, arrival weight, projected DOF and final live weight in yellow cells using slider bars Available on the CAB website (coming soon) and designed to work on iPad platform using Numbers “Confidential – Pfizer Internal Use Only”
Replacement Heifer Selection Advantages The expected increase in average GMX Score of progeny depends upon replacement heifer retention rates (intensity of selection) With 30% retention, average GMX Score of future progeny are 16 units higher versus random selection, and yield over $11 per progeny advantage from higher gain and grade – six progeny equate to $69, with previous assumptions “Confidential – Pfizer Internal Use Only”
Cow-Calf Strategies – GE-EPDs Powered by HD 50K and GeneMaxTM Buy HD 50K tested Angus bulls based on GE-EPDs and test heifer calves with GMX • Use GMX results to help select replacements • Improved progeny gain and grade • Sire-identified heifers from bulls with superior GE-EPDs for maternal traits backed by HD 50K • Use GMX results for better mating decisions • Wiser mating decisions as heifers and as cows, (i.e. lower GMX marbling females may be bred A.I. and/or naturally to sires with high marbling) • Use GMX Sire Match information to help avoid inbreeding for greater lifetime productivity • Use GMX results to help manage and market unselected/un-retained heifers, and for benchmarking/decision making on steer mates “Confidential – Pfizer Internal Use Only”