Download
1 / 25
250 likes | 405 Views
Interactive Exploration of Hierarchical Clustering Results HCE (Hierarchical Clustering Explorer). Jinwook Seo and Ben Shneiderman Human-Computer Interaction Lab Department of Computer Science University of Maryland, College Park jinwook@cs.umd.edu.

E N D
Interactive Exploration of Hierarchical Clustering ResultsHCE (Hierarchical Clustering Explorer) Jinwook Seo and Ben Shneiderman Human-Computer Interaction Lab Department of Computer Science University of Maryland, College Park jinwook@cs.umd.edu
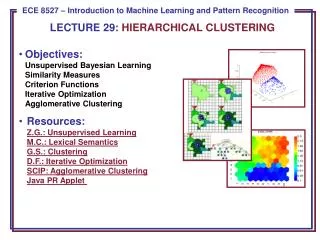
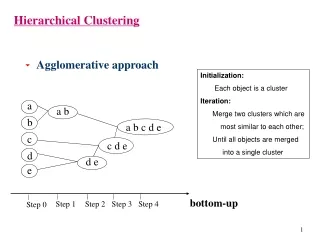
Cluster Analysis of Microarray Experiment Data • About 100 ~ 20,000 gene samples • Under 2 ~ 80 experimental conditions • Identify similar gene samples • startup point for studying unknown genes • Identify similar experimental conditions • develop a better treatment for a special group • Clustering algorithms • Hierarchical, K-means, etc.
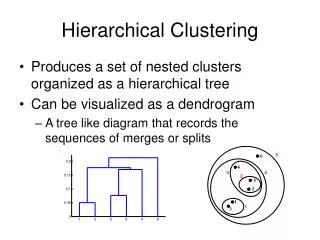
Dendrogram -3.64 4.87
Dendrogram -3.64 4.87
Dendrogram -3.64 4.87
Interactive Exploration Techniques • Dynamic Query Controls • Number of clusters, Level of detail • Coordinated Display • Bi-directional interaction with 2D scattergrams • Overview of the entire dataset • Coupled with detail view • Visual Comparison of Different Results • Different results by different methods
Demonstration • Nutrition facts of 77 cereals • 9 variables (nutrition components) • More demonstration • A.V. Williams Bldg, 3174 • 3:30-5:00pm, May 31. • Download HCE at • www.cs.umd.edu/hcil/multi-cluster
Dynamic Query Controls Filter out less similar genes • By pulling down the minimum similarity bar • Show only the clusters that satisfy the minimum similarity threshold • Help users determine the proper number of clusters • Easy to find the most similar genes
Dynamic Query Controls Adjust level of detail • By dragging up the detail cutoff bar • Show the representative pattern of each cluster • Hide detail below the bar • Easy to view global structure
Coordinated Displays • Two experimental conditions for the x and y axes • Two-dimensional scattergrams • limited to two variables at a time • readily understood by most users • users can concentrate on the data without distraction • Bi-directional interactions between displays
Overview in a limited screen space • What if there are more than 1,600 items to display? • Compressed Overview : averaging adjacent leaves • Easy to locate interesting spots Melanoma Microarray Experiment (3614 x 38)
Overview in a limited screen space • What if there are more than 1,600 items to display? • Alternative Overview : changing bar width (2~10) • Show more detail, but need scrolling
Cluster Comparison • There is no perfect clustering algorithm! • Different Distance Measures • Different Linkage Methods • Two dendrograms at the same time • Show the mapping of each gene between the two dendrograms • Busy screen with crossing lines • Easy to see anomalies
Conclusion • Integrate four features to interactively explore clustering results to gain a stronger understanding of the significance of the clusters • Overview, Dynamic Query, Coordination, Cluster Comparison • Powerful algorithms + Interactive tools • Bioinformatics Visualization www.cs.umd.edu/hcil/multi-cluster July 2002 IEEE Computer Special Issue on BioInformatics
A B C D Hierarchical Clustering Initial Data Items Distance Matrix
A B C D Hierarchical Clustering Initial Data Items Distance Matrix
A B C D Hierarchical Clustering Single Linkage Current Clusters Distance Matrix 2
A B C D Hierarchical Clustering Single Linkage Current Clusters Distance Matrix
A B C D Hierarchical Clustering Single Linkage Current Clusters Distance Matrix
A B C D Hierarchical Clustering Single Linkage Current Clusters Distance Matrix 3
A B C D Hierarchical Clustering Single Linkage Current Clusters Distance Matrix
A B C D Hierarchical Clustering Single Linkage Current Clusters Distance Matrix
A B C D Hierarchical Clustering Single Linkage Current Clusters Distance Matrix 10
A B C D Hierarchical Clustering Single Linkage Final Result Distance Matrix