Download
1 / 10
100 likes | 311 Views
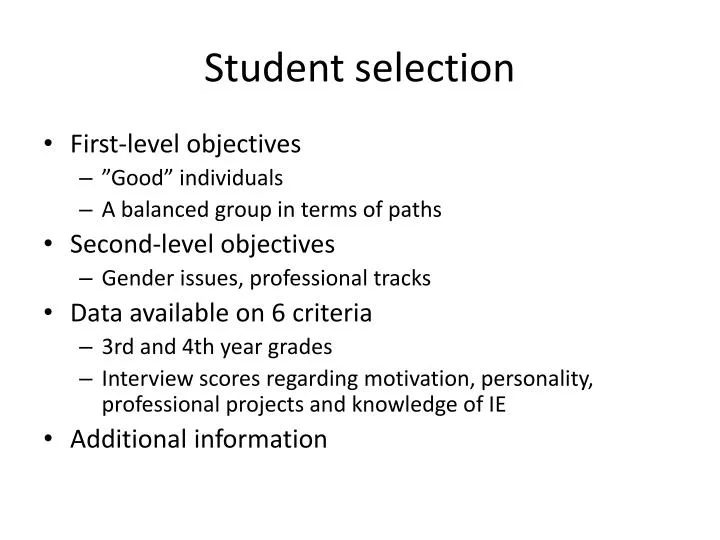
Student selection. First-level objectives ”Good” individuals A balanced group in terms of paths Second-level objectives Gender issues, professional tracks Data available on 6 criteria 3rd and 4th year grades

E N D
Student selection • First-level objectives • ”Good” individuals • A balanced group in terms of paths • Second-level objectives • Gender issues, professional tracks • Data available on 6 criteria • 3rd and 4th year grades • Interview scores regarding motivation, personality, professional projects and knowledge of IE • Additional information
Data analysis - correlation 2009 • Interview-based criteria are strongly positively correlated with one another • There is little correlation between the 3rd year grade and the other criteria in 2009 2010
Data analysis – PCA Factor loadings (2009) • The two first axes explain ca. 75% / 80% of the variation • First axis corresponds to interview criteria, the second to the grades Factor loadings (2010)
Initial screening • Minimum criterion-specific performances • Missing data etc. • Input: • Criterion scores • Path preferences Reject Reject students with CI=0 • RPM-screening • Loose statements on importance weights BLR Selected students with CI=1 UTA u(.) Further consider students with 0 < CI < 1 Ranking • Path allocation • Priority if CI=1 and path preference expressed • Path completed to have roughly equal distribution of gender and PT Ranking + Selection recommendations
Weight elicitation using BLR Full model Stepwise reduced model Cross-validation Normalized weights elicited from the full model Based on these, the weight information in the 2010 RPM-screening is given as: 4th, personality, knowledge > 3rd, motivation, professional project 4th, personality, knowledge > 0.1
2009 Post-decision analysis – RPM and ranking • RPM (loose weight statements) • Selecting the 14 borderline students according to the ranking resulting from the utility function with crisp weights, the actual 2009 selection is replicated with an exception of 1 student
= core students = selected borderline students = rejected borderline students = exterior students
Path allocation Matlab • Assign paths to satisfy the students’ preferences in the ranking order (core students prioritized) • Put the student ”on hold”, if • The preferred path is full • No preference information is available ILP with Excel Solver • Assign the ”on-hold” students such that the distribution of women and PTs is roughly equal across paths • Maximize the minimum number of women across paths, minimize the maximum number of students on a PT within and across paths
Path allocation - results Initial path allocation satisfying student preferences Final path allocation to balance out the PT and gender distribution