Download
1 / 1
10 likes | 99 Views
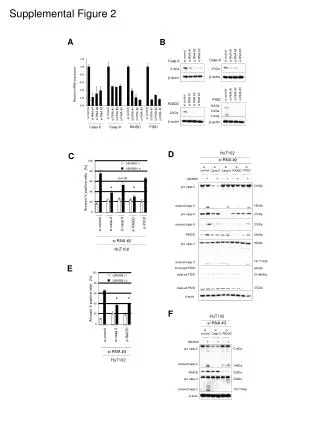
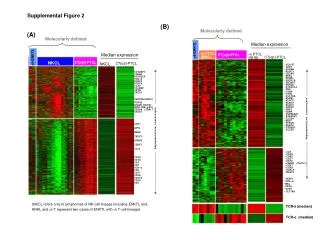
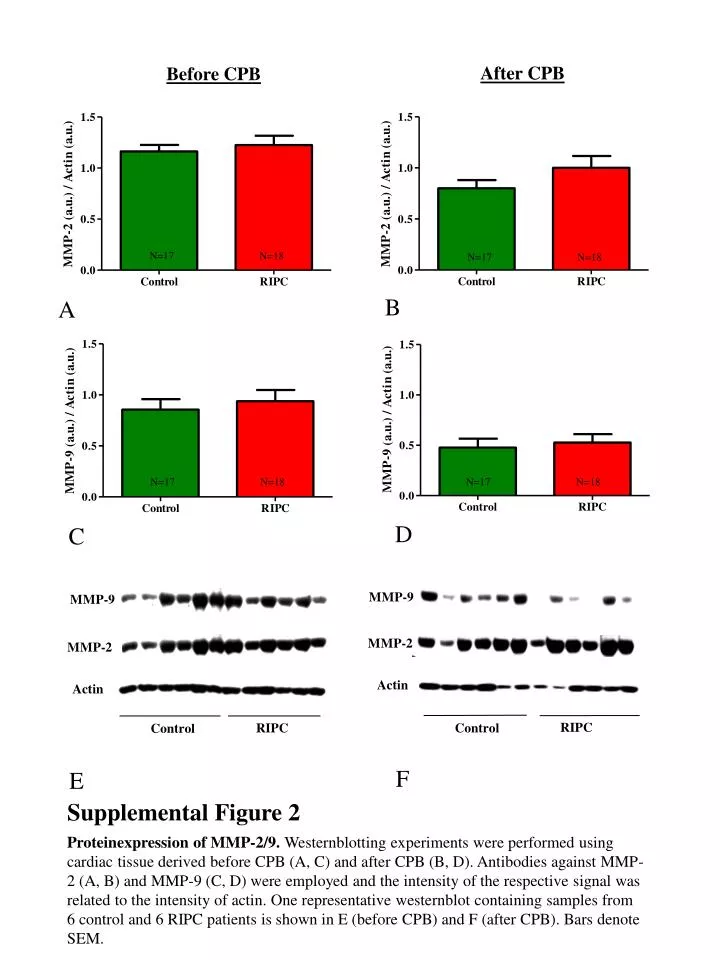
After CPB. Before CPB. N=17. N=18. N=17. N=18. B. A. N=17. N=18. N=17. N=18. D. C. MMP-9. MMP-9. MMP-2. MMP-2. Actin. Actin. RIPC. RIPC. Control. Control. F. E. Supplemental Figure 2.

E N D
After CPB Before CPB N=17 N=18 N=17 N=18 B A N=17 N=18 N=17 N=18 D C MMP-9 MMP-9 MMP-2 MMP-2 Actin Actin RIPC RIPC Control Control F E Supplemental Figure 2 Proteinexpression of MMP-2/9. Westernblotting experiments were performed using cardiac tissue derived before CPB (A, C) and after CPB (B, D). Antibodies against MMP-2 (A, B) and MMP-9 (C, D) were employed and the intensity of the respective signal was related to the intensity of actin. One representative westernblot containing samples from 6 control and 6 RIPC patients is shown in E (before CPB) and F (after CPB). Bars denote SEM.