Download
1 / 97
1.03k likes | 1.34k Views
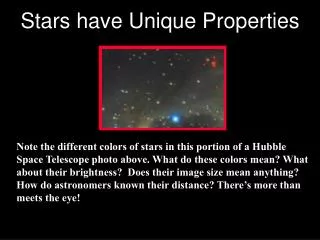
Properties of Stars. Distances to Stars. The distance to a nearby star can be measured by observing its parallax - the apparent shift of its position on the sky relative to more distant stars. Parallax is caused by Earth’s motion around the Sun.

E N D
Properties of Stars
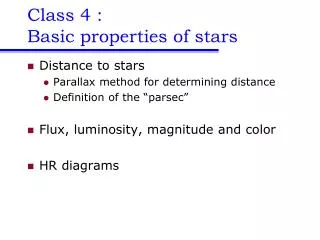
Distances to Stars The distance to a nearby star can be measured by observing its parallax- the apparent shift of its position on the sky relative to more distant stars. Parallax is caused by Earth’s motion around the Sun.
A parsec is the distance at which 1 AU subtends an angle of 1 arcsecond. 1 pc = 3.26 light years. A star with a parallax p = 1 arcsec must be 1 pc away: d (pc) = 1/p¢¢
Apparent vs. Intrinsic Brightness The apparent brightness of a light source depends on: (a) its intrinsic brightness (a.k.a. luminosity) (b) its distance from us.
L F = _____ 4pd 2 L = intrinsic luminosity (energy emitted per second) d = distance to light source F = flux (i.e., apparent brightness) Inverse-Square Law The apparent brightness of a star decreases as the distance to the star increases. Brightness is proportional to 1/d 2.
L = 4pR2s T 4 Luminosities of Stars • From the Stefan-Boltzmann Law, the hotter a star is, the more energy it emits per square meter of surface area per second. • The larger the radius of a star, the greater its surface area. • So, we can express a star’s luminosity as: • Thus, if we can measure the apparent brightness and distance of a star and can estimate its temperature (from Wien’s Law) we can determine: Luminosity (from apparent brightness and distance) Radius (from luminosity and temperature)
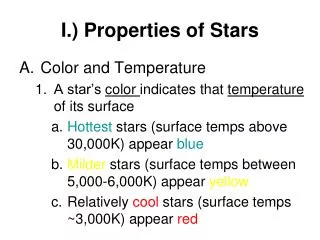
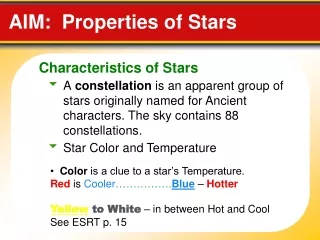
Stellar Spectra • Recall that the temperature of a star determines: • • the overall shape of its • spectrum • • the spectral line features • it exhibits
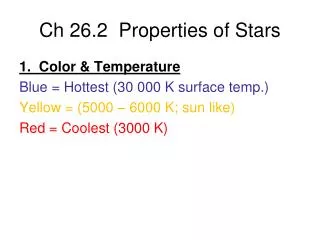
Stellar Spectra What do the letters O, B, A, F, G, K, M mean?
Spectral Classification So, the spectral class sequence is really a temperature sequence.
The H-R Diagram Plotting the luminosities of stars vs. their spectral types (i.e., temperatures) we find that stars follow certain well-defined patterns.
The H-R Diagram Another H-R Diagram:
L = 4pR2s T 4 How can stars of the same spectral type have different luminosities? Recall that Thus, stars that have the same spectral type (i.e., temperature) but different luminosities must have different radii.
Sizes of Stars We can estimate the radii of stars. We call them “dwarfs,” “giants,” or “supergiants” according to their sizes. 90% of the stars we observe are dwarfs on the “Main Sequence.”
Luminosity Class We divide dwarf, giant, and supergiant stars into various luminosity classes, denoted I-V. Stars that have the same spectral type but different luminosity classes are distinguished by the widths and strengths of the absorption lines in their spectra.
Stellar Demographics There are many more small, faint red dwarf stars on the main sequence than large, luminous blue stars. There are many more main sequence stars than giant or supergiant stars.
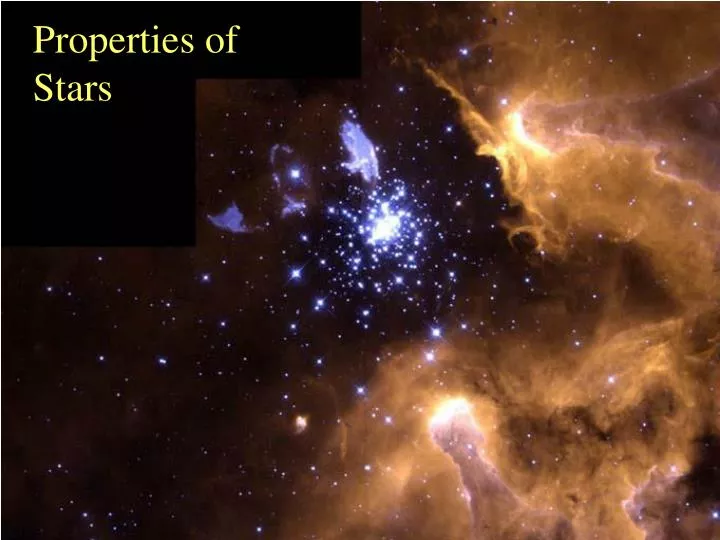
Different types of nebulae: The Horsehead Nebula in the constellation of Orion
Emission Nebulae Hot, blue stars emit a lot of ionizing radiation, which excites the gas that surrounds them.
Lifetimes of Hot, Luminous Stars The big, hot, luminous, blue stars on the upper part of the main sequence have relatively short lifetimes.
Star formation and gas clouds These hot, blue stars are often found associated with gas clouds in the Milky Way. Because of this association, we believe all stars must be born in such gas clouds.
The collapse of a gas cloud Stars form from the rapid collapse of a gas cloud due to gravitational forces. As the cloud collapses, it converts gravitational energy into thermal energy and heats up. The pressure in the gas increases as the particles in the gas move faster and faster in random directions. This pressure will push outwards against the gravitational forces. At the same time the gas cloud will be losing thermal energy through radiation so this increase in pressure is usually not enough to halt the collapse.
Collapse of a gas cloud Because of the conservation of angular momentum, any rotation of the cloud will be amplified as it collapses. A protostar will be surrounded by a swirling disk of material. Early stages of star formation are hidden from our view by the dense cloud of gas still surrounding it.
Star formation and gas clouds The Eagle Nebula
Protostar Evolution The rapid collapse of the gas cloud will slow down as the temperature and pressure increases in its center. The protostar formed at the center of the cloud will then gradually contract and heat up until...
A star is born… ...the gas at the center of the star is hot and dense enough to ignite nuclear fusion. This will maintain the pressure and temperature of the gas sufficiently to balance the immense gravitational forces and halt the contraction of the protostar.
Protostar Evolution The more massive a star is, the more quickly it is born.
Stellar Energy Sources In stars like the sun, most of the energy is produced via the proton-proton chain, in which 4 H atoms are fused into a single He atom, and energy is released.
Stellar Energy Sources In higher mass stars, some of the energy produced in the stellar core comes from a different nuclear reaction chain, called the CNO cycle.
Young Stars When a star is very young, the outpouring of energy from nuclear fusion can drive away the remains of the gas cloud surrounding it, but it will usually still be surrounded by a dark disk of material which is in the process of falling onto the star (and may eventually form planets!).
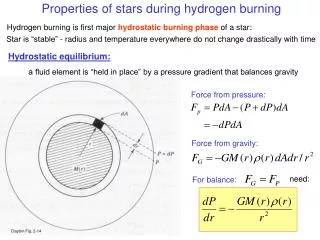
Hydrostatic Equilibrium In a stable star, the inward pull of gravity is exactly balanced by the outward force of gas pressure at each level within the star. This is known as the law of hydrostatic equilibrium. When stars are not in hydrostatic equilibrium, they will either expand or contract.
Stellar Energy Sources One key piece of the puzzle is how stars produce energy. Most of the energy is produced in their cores via the fusion of 4 H atoms into a He atom.
Energy Transport in Stars Another physical process that is important inside stars is the way in which energy gets transported from the core to the surface. For normal stars, this happens by convection, radiation, or both.
Energy Transport in Stars In the sun, energy is transported via radiation in the central regions, but by convection in the outer regions.
Energy Transport in Stars Cross sections of main sequence stars of different masses, showing the modes of energy transport the different stars use.
Modeling Stellar Structure The structure and evolution of stars is accurately modeled with only a few well understood laws of physics. Astronomers use these laws and powerful computers to compute stellar models.
Main-Sequence Lifetime vs. Mass • All stars, regardless of their mass, spend roughly 90% of • their total lifetimes as main sequence stars. • Stars end their main sequence lives when their supply of • hydrogen fuel runs out in the core. • The most massive stars (O and B types) have very short • lifetimes compared to low-mass stars (K and M types).
Main-Sequence Evolution Stars begin their main sequence lives when they initiate hydrogen burning in their cores. They are located on the zero-age main sequence (ZAMS) at this time. As they age, they evolve slowly away from the ZAMS.
Post-MS Evolution When stars evolve away from the main sequence they become red giants. Recall that the equation L = 4pR2sT 4 defines lines of constant radius on an H-R diagram. Red giants are… giant and red.
Post-MS Evolution The sun today and the sun as a red giant star.
Post-MS Evolution H-R diagram showing the evolutionary paths followed by stars that are more massive than the sun. Note how these two tracks pass through the regions occupied by giant and supergiant stars.
6 5 3 4 1 2 Post-MS evolutionary track for a 5 Msun star, including the helium ignition stage, the helium core-burning phase, and the asymptotic giant branch phase.
Post-MS Evolution A red giant star (cross section), showing the compact helium core, H-burning shell, and bloated outer envelope. Note the size of the present day sun, for comparison.
How can we test stellar evolution models? H-R diagram for a group of stars all born at the same time: hot, massive stars evolve the most rapidly. Over time, main sequence stars of progressively lower temps/masses peel away to the giant regions on the diagram.