Download
1 / 2
20 likes | 21 Views
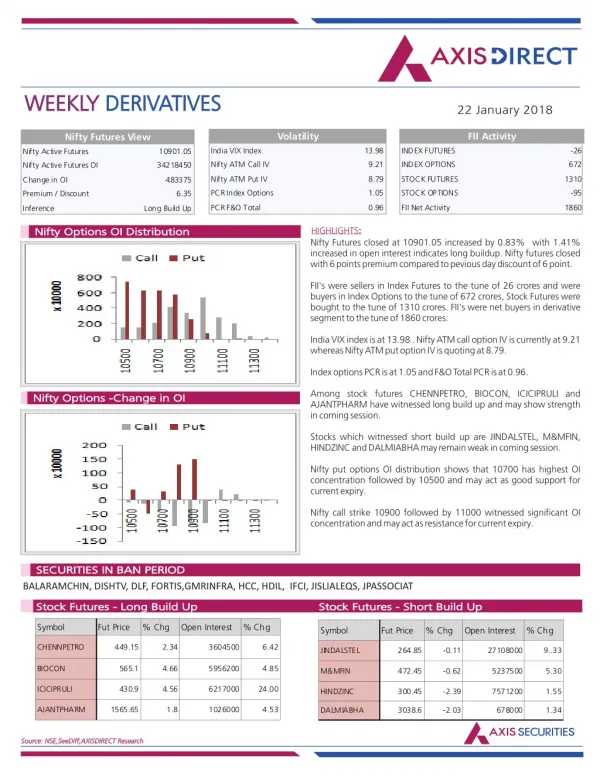
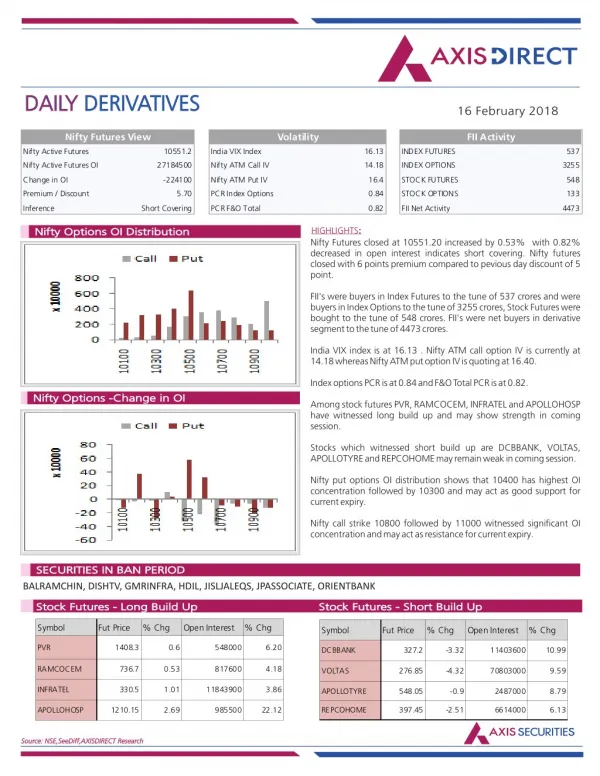
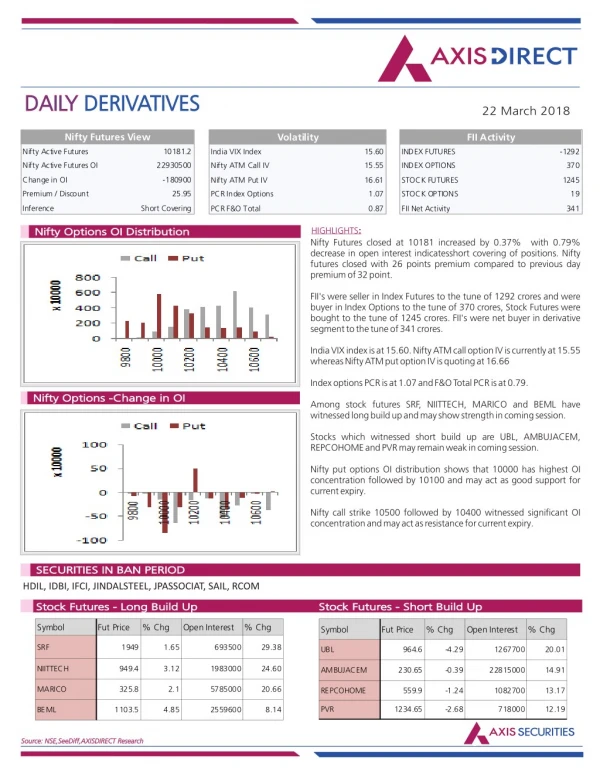
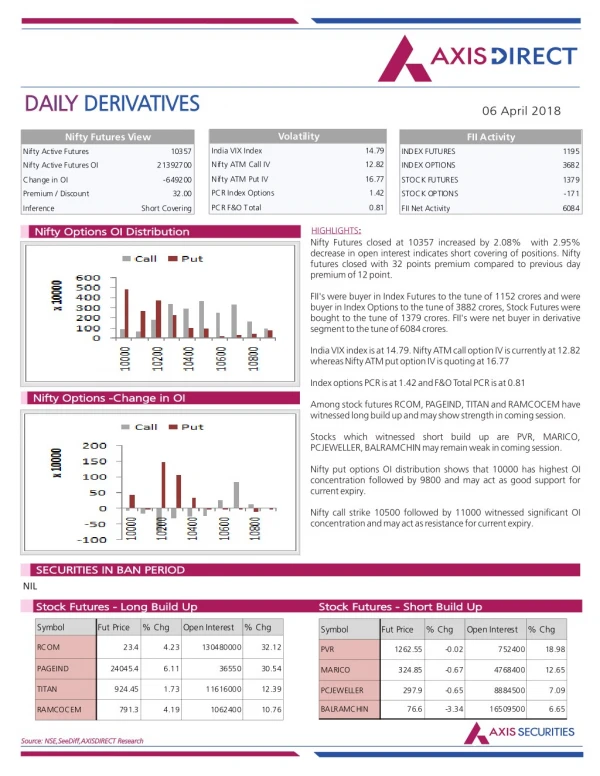
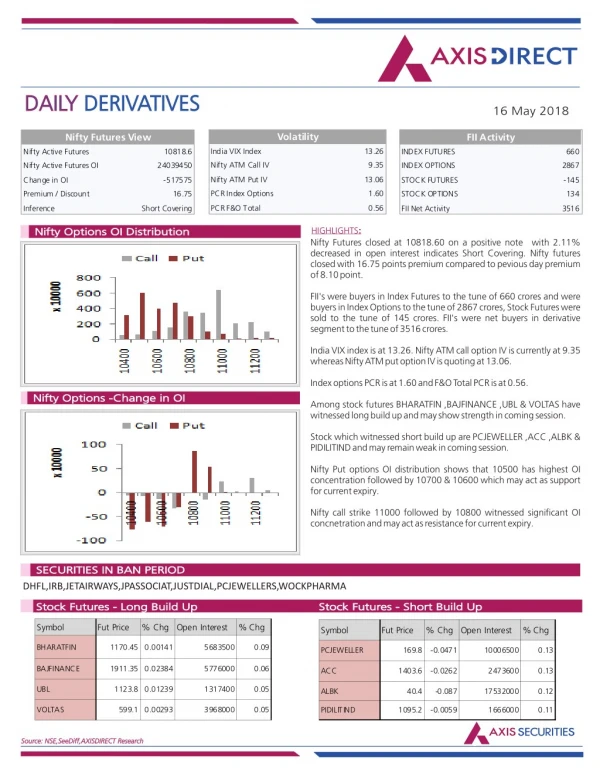
Axis Direct presents daily derivatives report presenting recommendations based on technical analysis. For trading in derivatives visit https://simplehai.axisdirect.in/offerings/products/derivatives<br>https://simplehai.axisdirect.in/share-stock-prices/nse/ICICI-Bank-Ltd-5418<br>https://simplehai.axisdirect.in/share-stock-prices/nse/State-Bank-of-India-1375

E N D
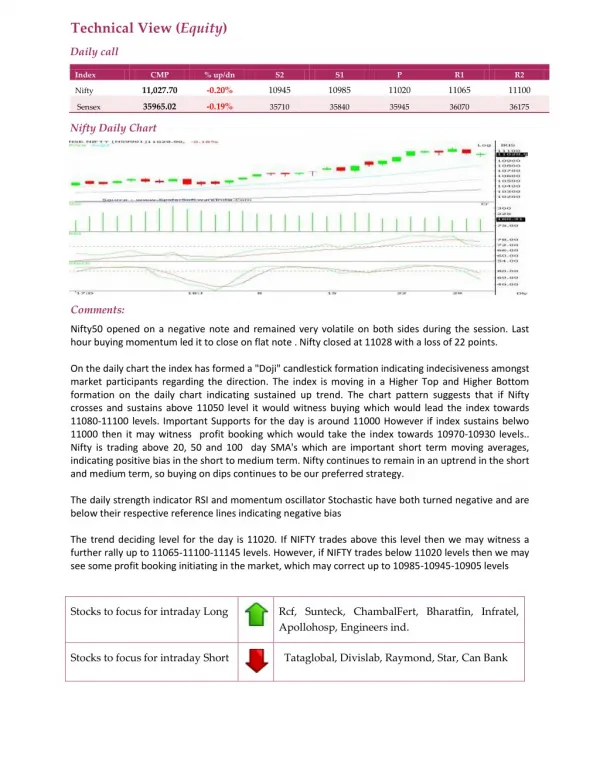
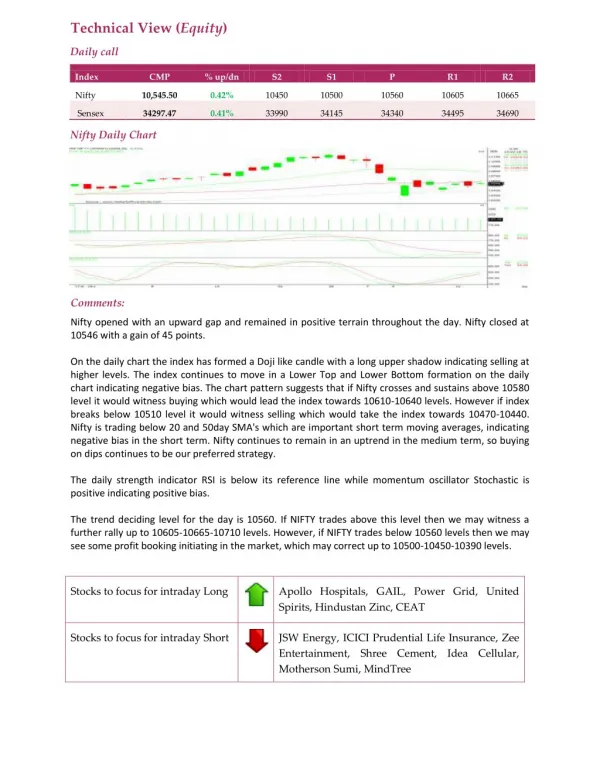
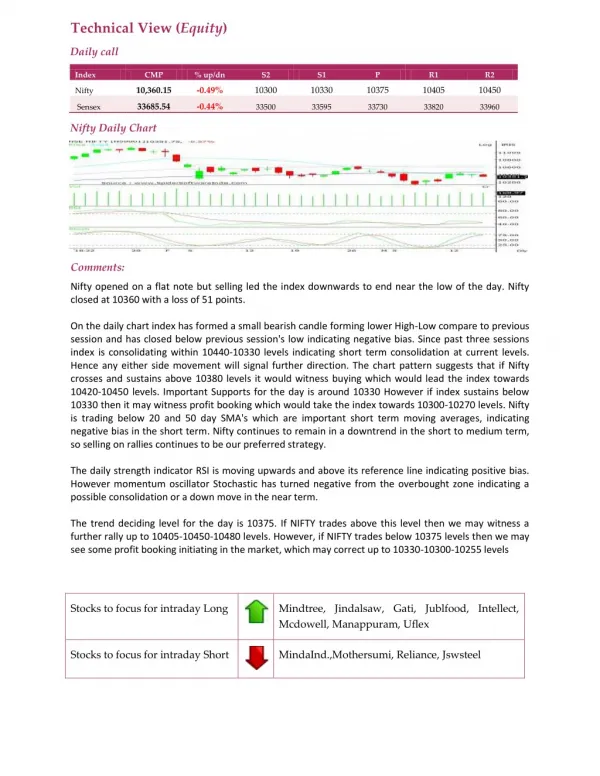
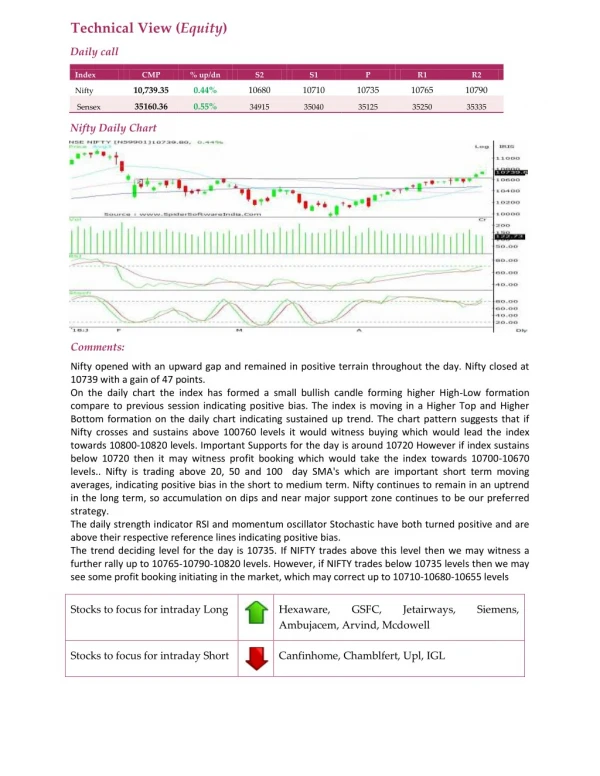
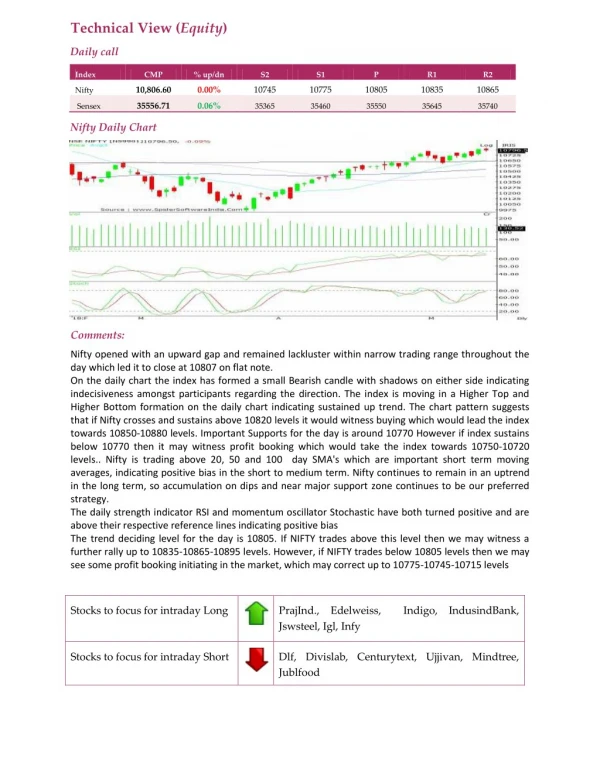
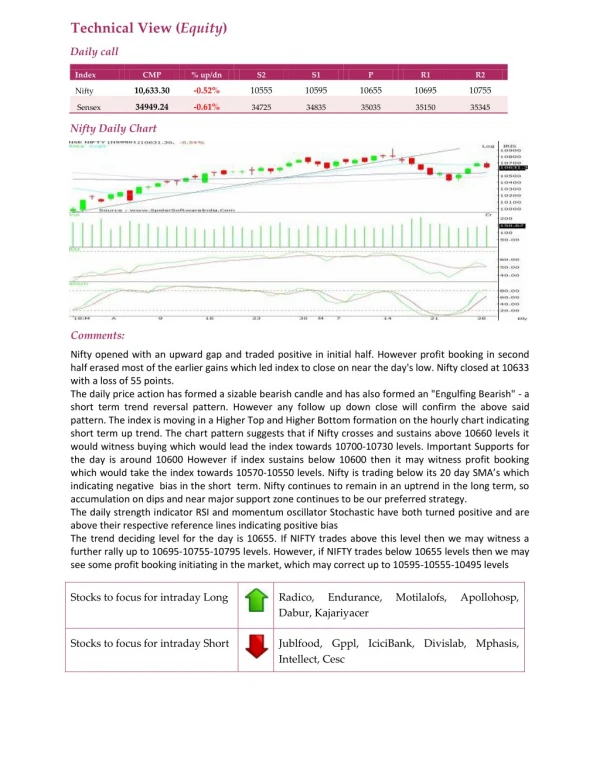
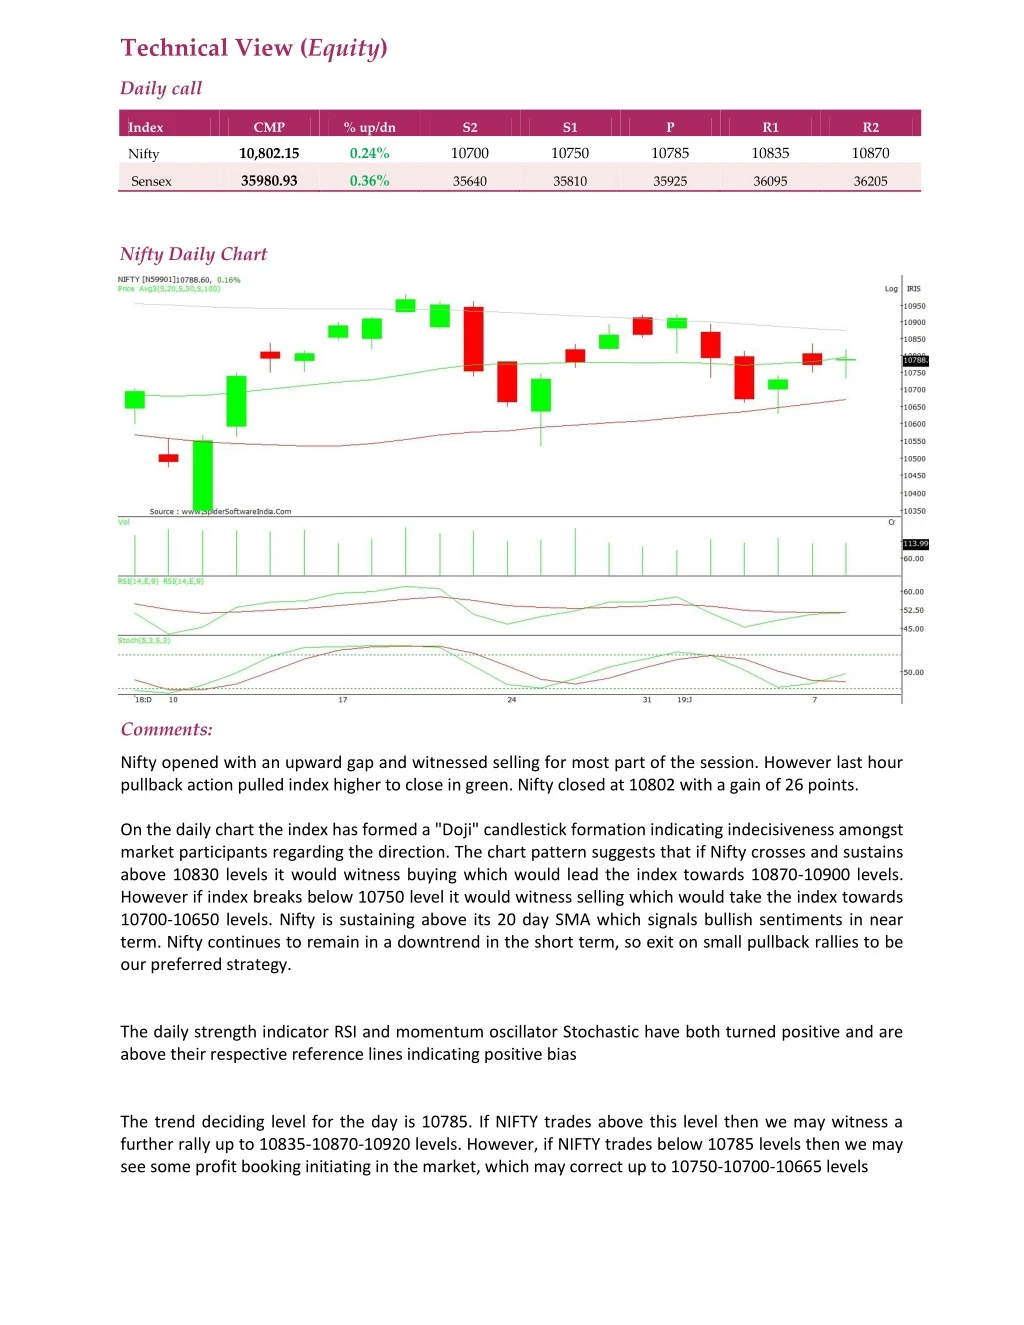
Technical View (Equity) Daily call Index CMP % up/dn S2 S1 P R1 R2 10,802.15 0.24% 10700 10750 10785 10835 10870 Nifty 35980.93 0.36% Sensex 35640 35810 35925 36095 36205 Nifty Daily Chart Comments: Nifty opened with an upward gap and witnessed selling for most part of the session. However last hour pullback action pulled index higher to close in green. Nifty closed at 10802 with a gain of 26 points. On the daily chart the index has formed a "Doji" candlestick formation indicating indecisiveness amongst market participants regarding the direction. The chart pattern suggests that if Nifty crosses and sustains above 10830 levels it would witness buying which would lead the index towards 10870-10900 levels. However if index breaks below 10750 level it would witness selling which would take the index towards 10700-10650 levels. Nifty is sustaining above its 20 day SMA which signals bullish sentiments in near term. Nifty continues to remain in a downtrend in the short term, so exit on small pullback rallies to be our preferred strategy. The daily strength indicator RSI and momentum oscillator Stochastic have both turned positive and are above their respective reference lines indicating positive bias The trend deciding level for the day is 10785. If NIFTY trades above this level then we may witness a further rally up to 10835-10870-10920 levels. However, if NIFTY trades below 10785 levels then we may see some profit booking initiating in the market, which may correct up to 10750-10700-10665 levels
Stocks to focus for intraday Long Grasim, Icicibank, Maruti, Sbin, Sunpharma Stocks to focus for intraday Short Bajfinance, Bpcl, Coalindia, Hdfcbank, Hindalco