Download
1 / 2
20 likes | 32 Views
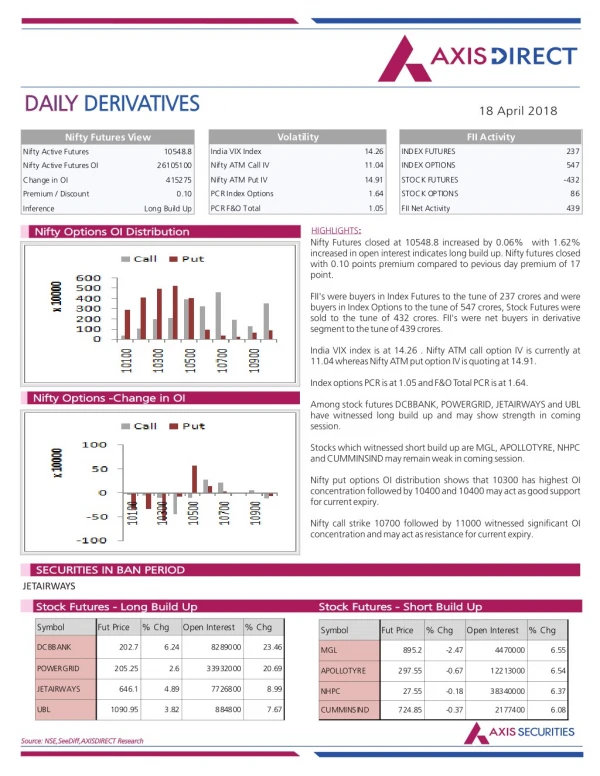
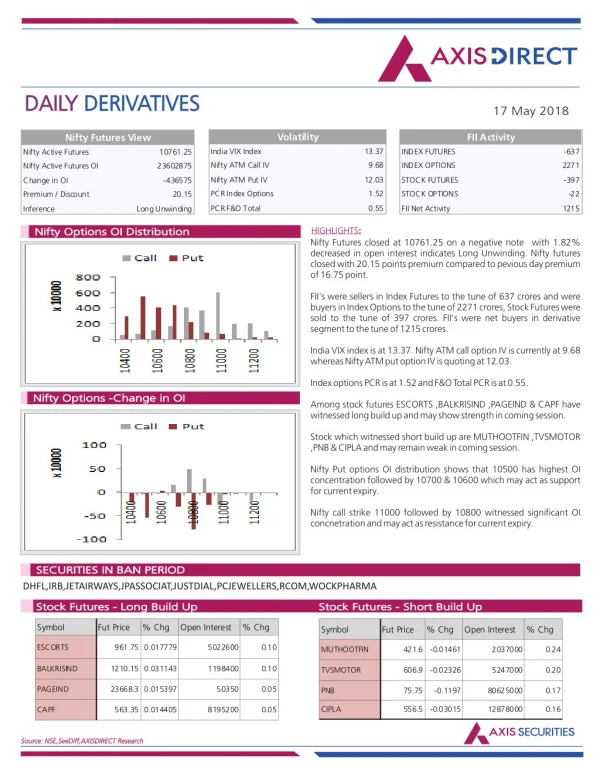
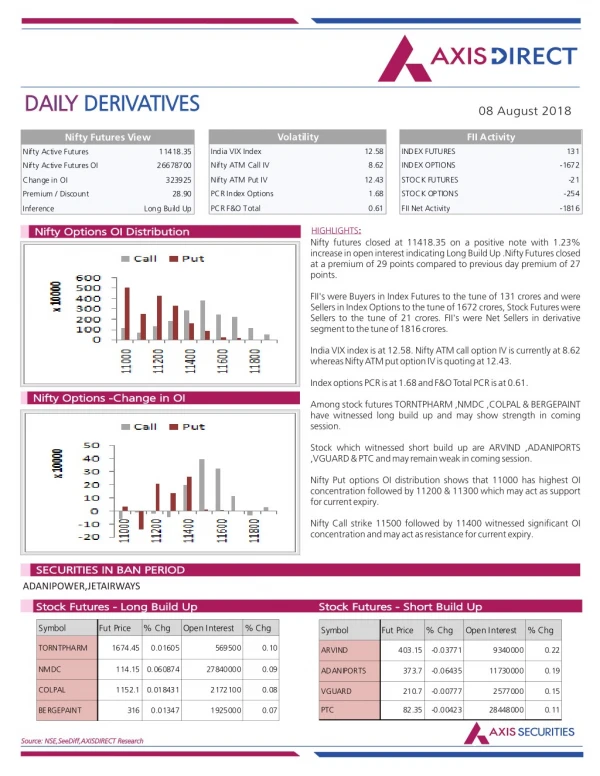
Axis Direct presents daily derivatives report presenting recommendations based on technical analysis. For trading in derivatives visit https://simplehai.axisdirect.in/offerings/products/derivatives

E N D
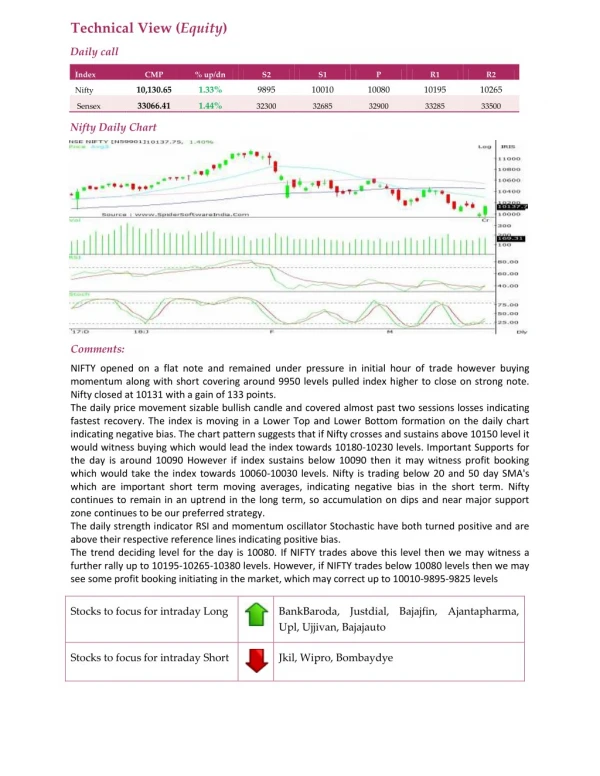
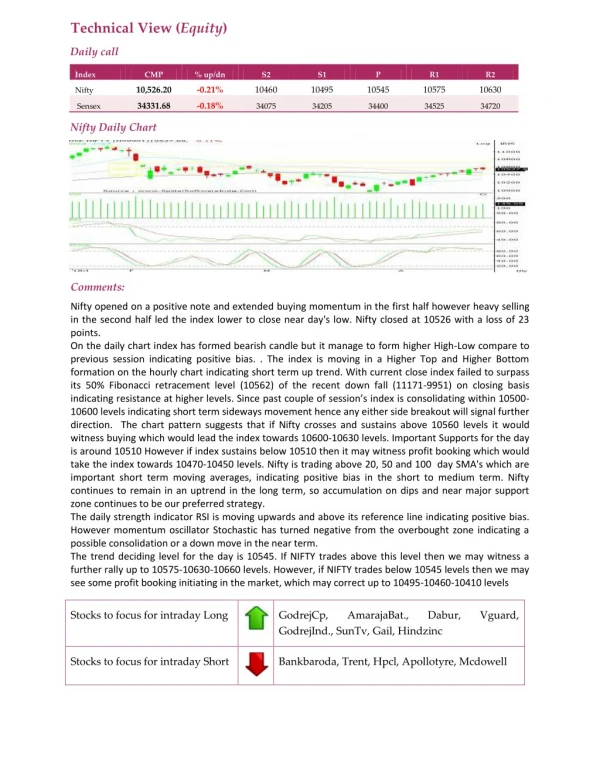
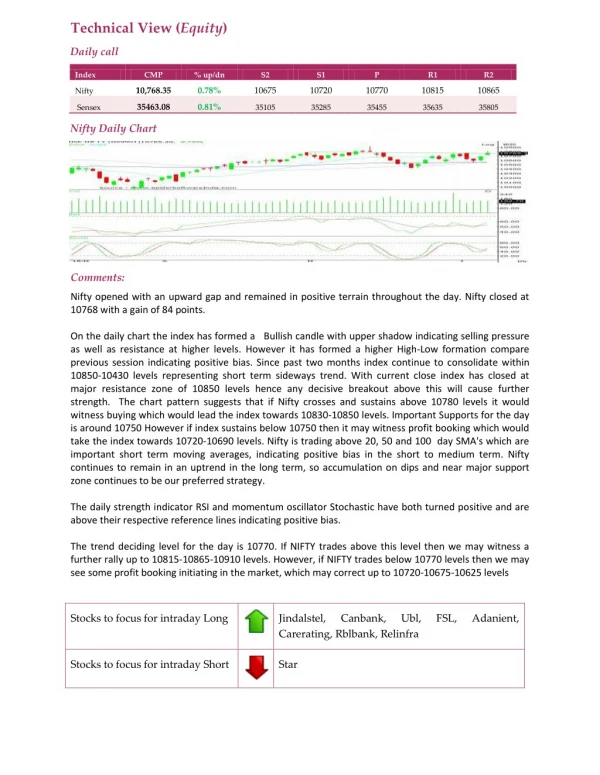
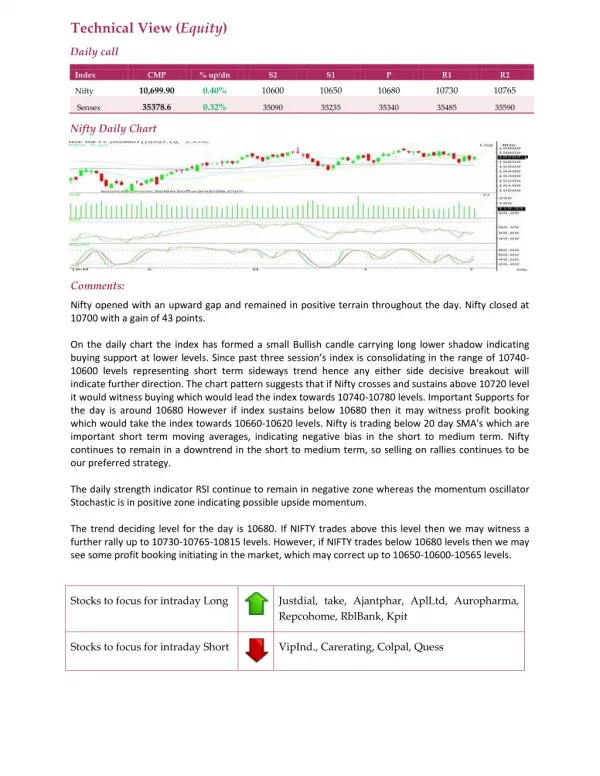
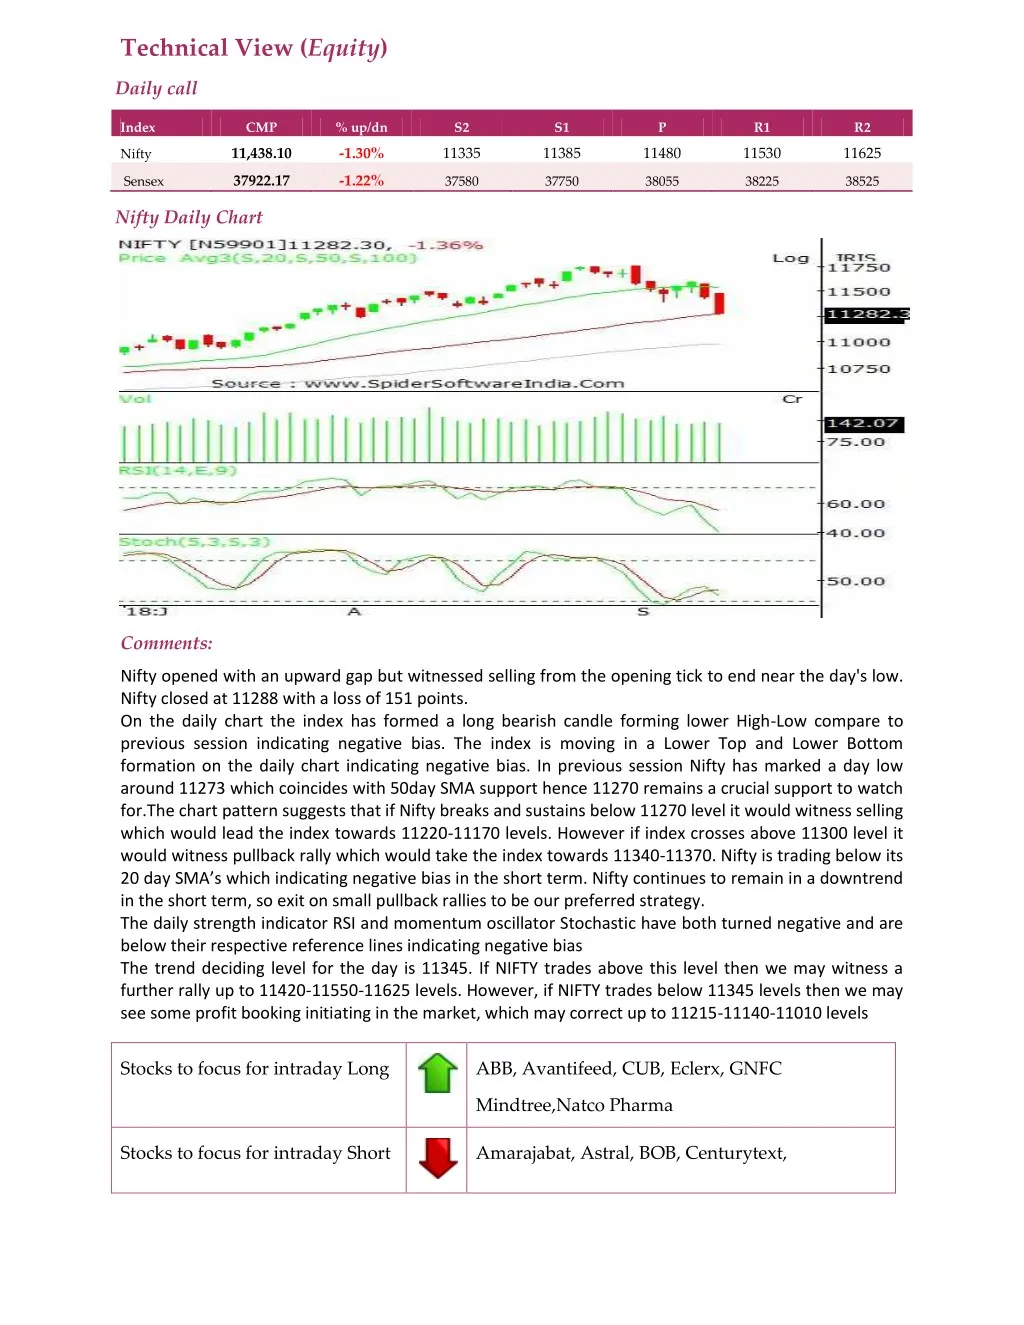
Technical View (Equity) Daily call Index CMP % up/dn S2 S1 P R1 R2 11,438.10 -1.30% 11335 11385 11480 11530 11625 Nifty 37922.17 -1.22% Sensex 37580 37750 38055 38225 38525 Nifty Daily Chart Comments: Nifty opened with an upward gap but witnessed selling from the opening tick to end near the day's low. Nifty closed at 11288 with a loss of 151 points. On the daily chart the index has formed a long bearish candle forming lower High-Low compare to previous session indicating negative bias. The index is moving in a Lower Top and Lower Bottom formation on the daily chart indicating negative bias. In previous session Nifty has marked a day low around 11273 which coincides with 50day SMA support hence 11270 remains a crucial support to watch for.The chart pattern suggests that if Nifty breaks and sustains below 11270 level it would witness selling which would lead the index towards 11220-11170 levels. However if index crosses above 11300 level it would witness pullback rally which would take the index towards 11340-11370. Nifty is trading below its 20 day SMA’s which indicating negative bias in the short term. Nifty continues to remain in a downtrend in the short term, so exit on small pullback rallies to be our preferred strategy. The daily strength indicator RSI and momentum oscillator Stochastic have both turned negative and are below their respective reference lines indicating negative bias The trend deciding level for the day is 11345. If NIFTY trades above this level then we may witness a further rally up to 11420-11550-11625 levels. However, if NIFTY trades below 11345 levels then we may see some profit booking initiating in the market, which may correct up to 11215-11140-11010 levels Stocks to focus for intraday Long ABB, Avantifeed, CUB, Eclerx, GNFC Mindtree,Natco Pharma Stocks to focus for intraday Short Amarajabat, Astral, BOB, Centurytext,