Download
1 / 2
20 likes | 24 Views
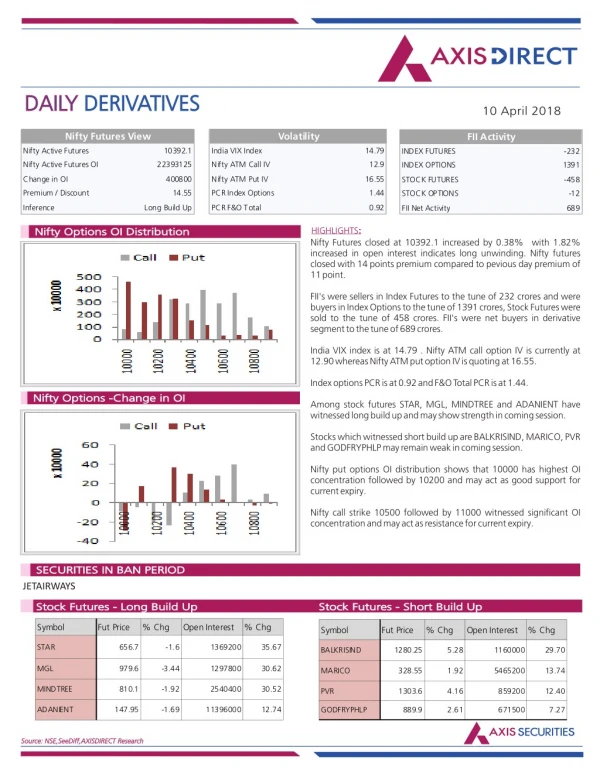
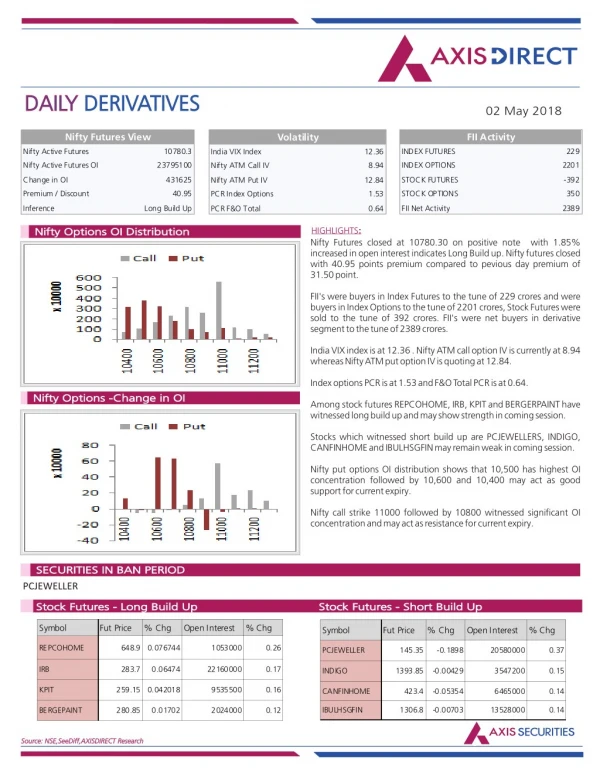
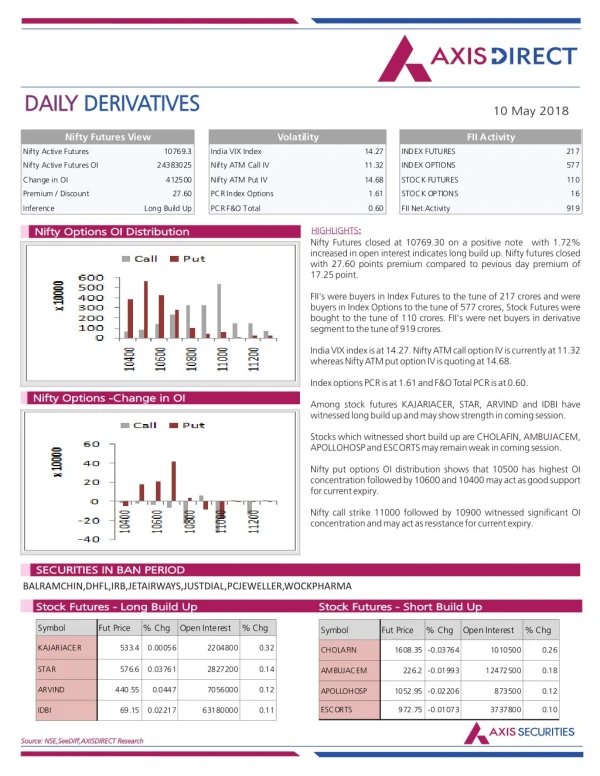
Axis Direct presents daily derivatives report presenting recommendations based on technical analysis. For trading in derivatives visit https://simplehai.axisdirect.in/offerings/products/derivatives<br>https://simplehai.axisdirect.in/share-stock-prices/nse/Adani-Ports-&-Special-Economic-Zone-Ltd-21281<br>https://simplehai.axisdirect.in/share-stock-prices/nse/Infosys-Ltd-2806

E N D
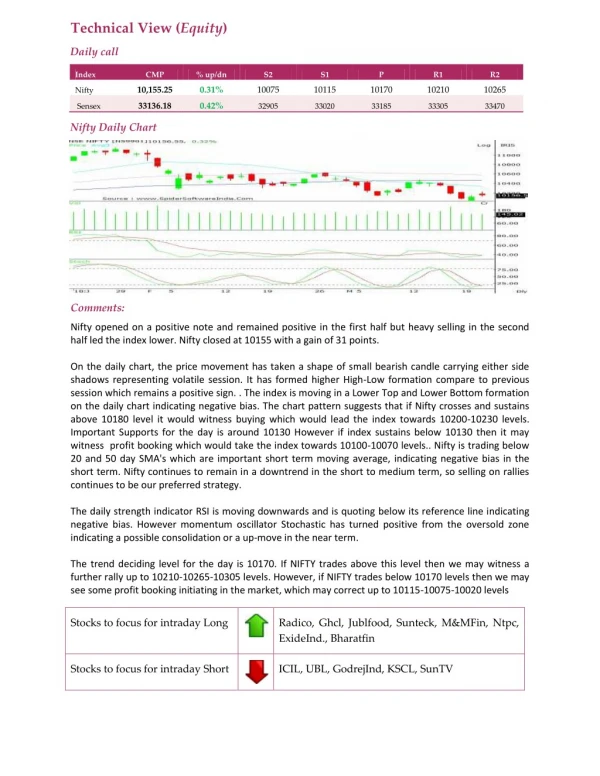
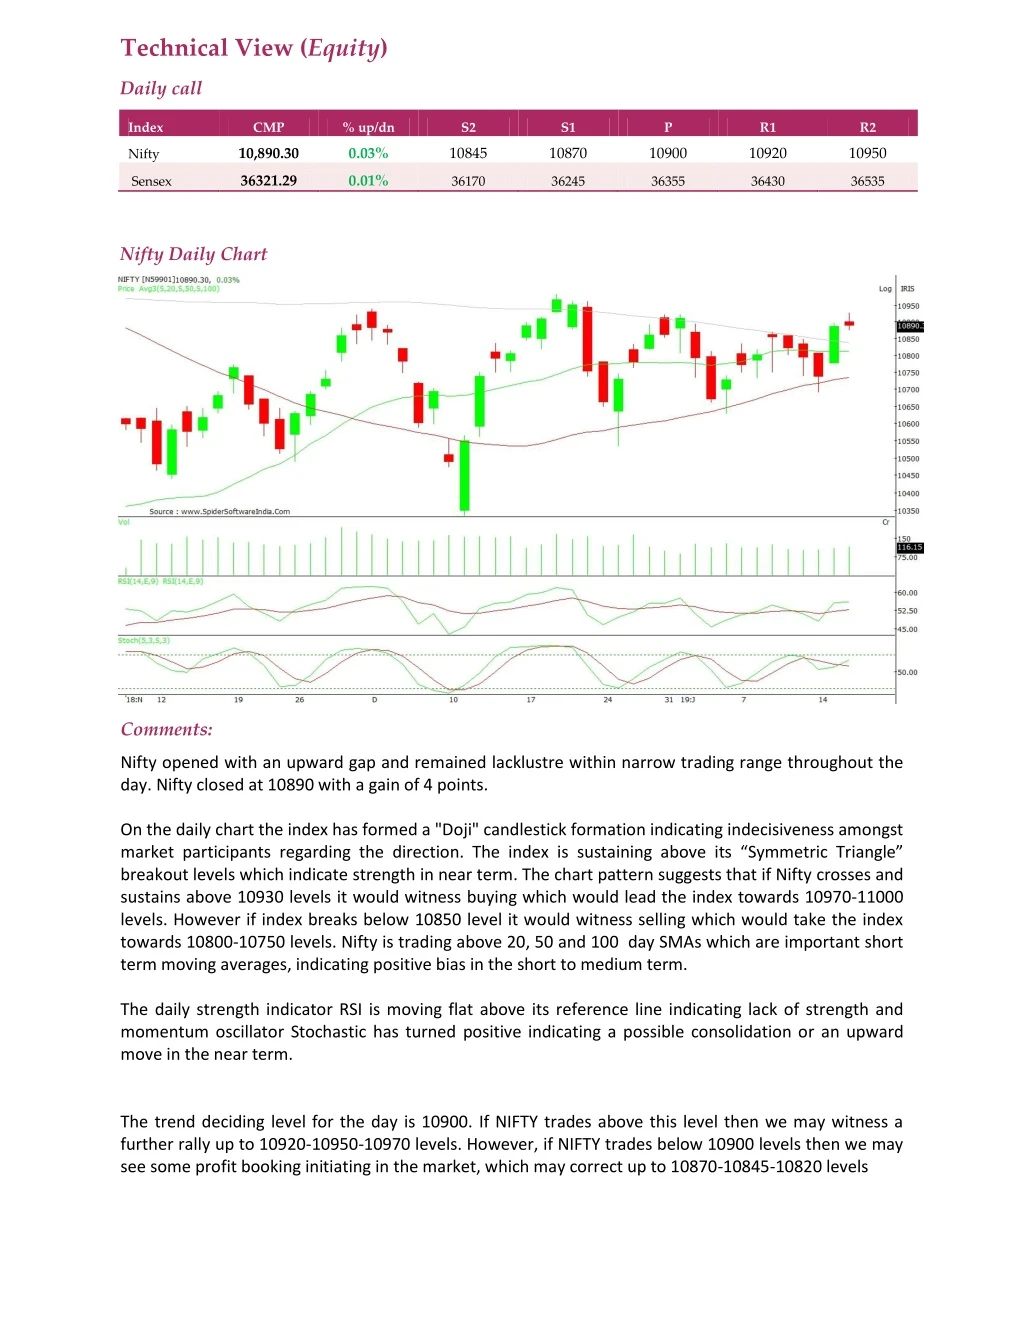
Technical View (Equity) Daily call Index CMP % up/dn S2 S1 P R1 R2 10,890.30 0.03% 10845 10870 10900 10920 10950 Nifty 36321.29 0.01% Sensex 36170 36245 36355 36430 36535 Nifty Daily Chart Comments: Nifty opened with an upward gap and remained lacklustre within narrow trading range throughout the day. Nifty closed at 10890 with a gain of 4 points. On the daily chart the index has formed a "Doji" candlestick formation indicating indecisiveness amongst market participants regarding the direction. The index is sustaining above its “Symmetric Triangle” breakout levels which indicate strength in near term. The chart pattern suggests that if Nifty crosses and sustains above 10930 levels it would witness buying which would lead the index towards 10970-11000 levels. However if index breaks below 10850 level it would witness selling which would take the index towards 10800-10750 levels. Nifty is trading above 20, 50 and 100 day SMAs which are important short term moving averages, indicating positive bias in the short to medium term. The daily strength indicator RSI is moving flat above its reference line indicating lack of strength and momentum oscillator Stochastic has turned positive indicating a possible consolidation or an upward move in the near term. The trend deciding level for the day is 10900. If NIFTY trades above this level then we may witness a further rally up to 10920-10950-10970 levels. However, if NIFTY trades below 10900 levels then we may see some profit booking initiating in the market, which may correct up to 10870-10845-10820 levels
Stocks to focus for intraday Long Adaniports, Drreddy, Ibulhsgfin, Indusindbk, Infy, Ioc Stocks to focus for intraday Short Infratel, Kotakbank, Maruti, Zeel, Ajantpharm