Download
1 / 1
10 likes | 26 Views
Axis Direct presents daily derivatives report presenting recommendations based on technical analysis. For trading in derivatives visit https://simplehai.axisdirect.in/offerings/products/derivatives<br>https://simplehai.axisdirect.in/share-stock-prices/nse/CEAT-Ltd-104

E N D
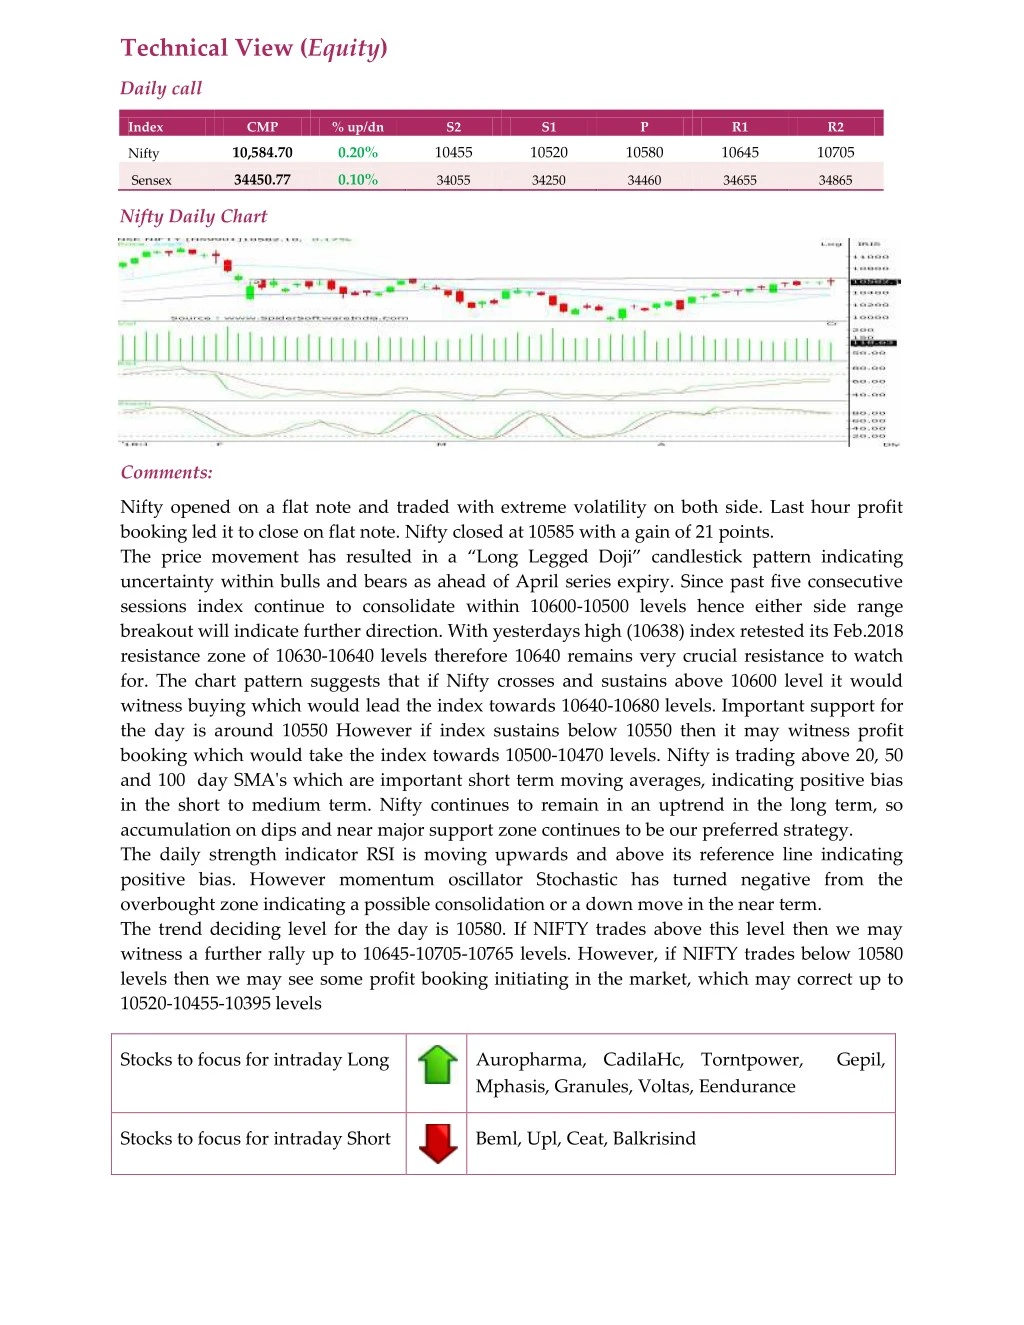
Technical View (Equity) Daily call Index CMP % up/dn S2 S1 P R1 R2 10,584.70 0.20% 10455 10520 10580 10645 10705 Nifty 34450.77 0.10% Sensex 34055 34250 34460 34655 34865 Nifty Daily Chart Comments: Nifty opened on a flat note and traded with extreme volatility on both side. Last hour profit booking led it to close on flat note. Nifty closed at 10585 with a gain of 21 points. The price movement has resulted in a “Long Legged Doji” candlestick pattern indicating uncertainty within bulls and bears as ahead of April series expiry. Since past five consecutive sessions index continue to consolidate within 10600-10500 levels hence either side range breakout will indicate further direction. With yesterdays high (10638) index retested its Feb.2018 resistance zone of 10630-10640 levels therefore 10640 remains very crucial resistance to watch for. The chart pattern suggests that if Nifty crosses and sustains above 10600 level it would witness buying which would lead the index towards 10640-10680 levels. Important support for the day is around 10550 However if index sustains below 10550 then it may witness profit booking which would take the index towards 10500-10470 levels. Nifty is trading above 20, 50 and 100 day SMA's which are important short term moving averages, indicating positive bias in the short to medium term. Nifty continues to remain in an uptrend in the long term, so accumulation on dips and near major support zone continues to be our preferred strategy. The daily strength indicator RSI is moving upwards and above its reference line indicating positive bias. However momentum oscillator Stochastic has turned negative from the overbought zone indicating a possible consolidation or a down move in the near term. The trend deciding level for the day is 10580. If NIFTY trades above this level then we may witness a further rally up to 10645-10705-10765 levels. However, if NIFTY trades below 10580 levels then we may see some profit booking initiating in the market, which may correct up to 10520-10455-10395 levels Stocks to focus for intraday Long Auropharma, CadilaHc, Torntpower, Gepil, Mphasis, Granules, Voltas, Eendurance Stocks to focus for intraday Short Beml, Upl, Ceat, Balkrisind