Download
1 / 2
20 likes | 24 Views
Axis Direct presents daily derivatives report presenting recommendations based on technical analysis. For trading in derivatives visit https://simplehai.axisdirect.in/offerings/products/derivatives

E N D
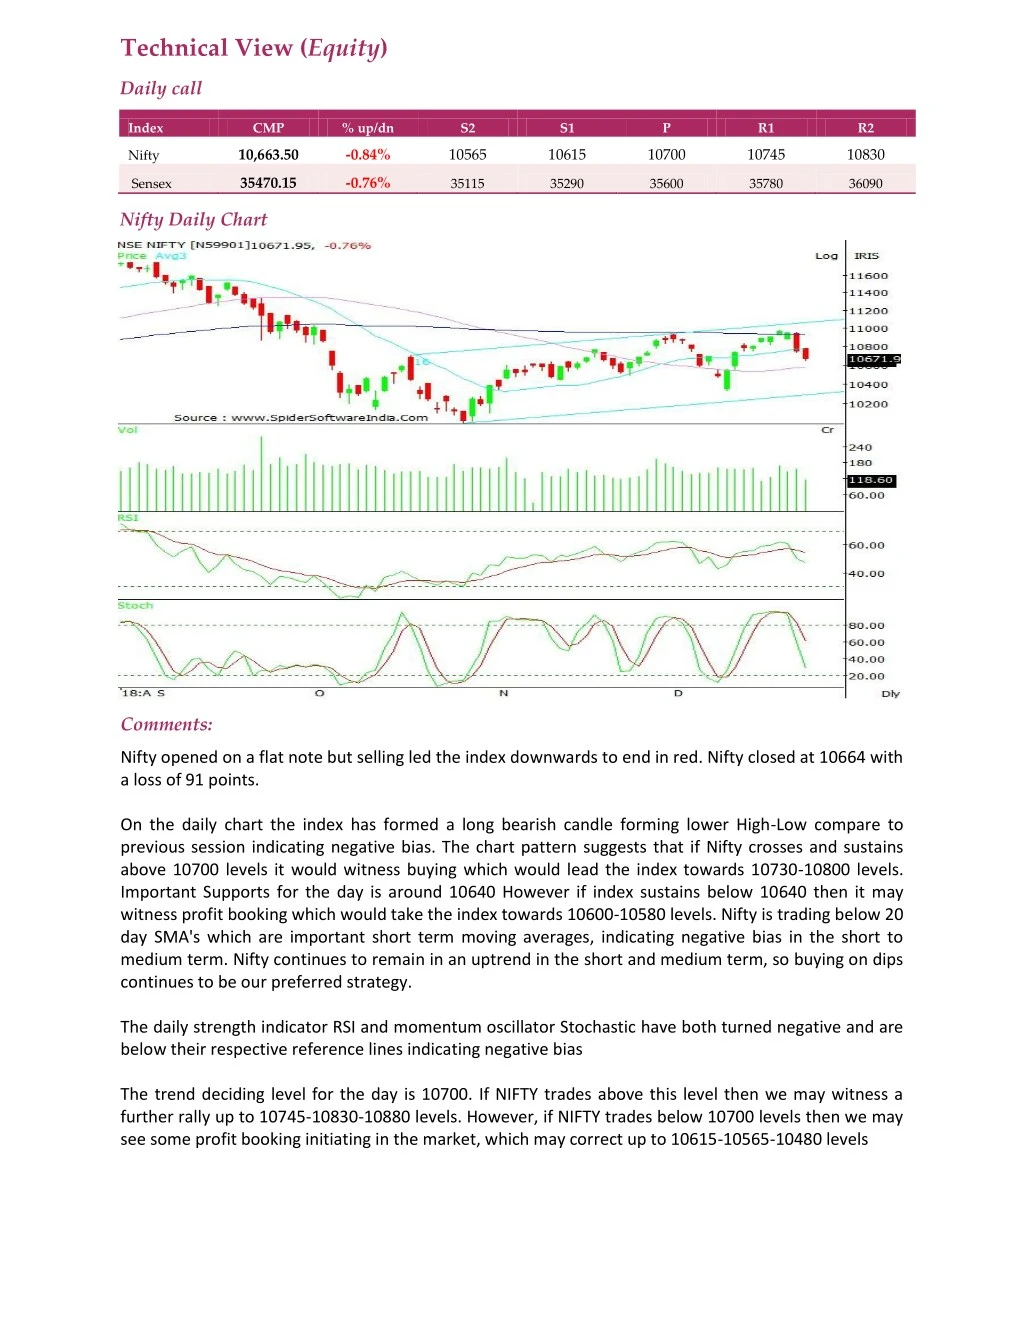
Technical View (Equity) Daily call Index CMP % up/dn S2 S1 P R1 R2 10,663.50 -0.84% 10565 10615 10700 10745 10830 Nifty 35470.15 -0.76% Sensex 35115 35290 35600 35780 36090 Nifty Daily Chart Comments: Nifty opened on a flat note but selling led the index downwards to end in red. Nifty closed at 10664 with a loss of 91 points. On the daily chart the index has formed a long bearish candle forming lower High-Low compare to previous session indicating negative bias. The chart pattern suggests that if Nifty crosses and sustains above 10700 levels it would witness buying which would lead the index towards 10730-10800 levels. Important Supports for the day is around 10640 However if index sustains below 10640 then it may witness profit booking which would take the index towards 10600-10580 levels. Nifty is trading below 20 day SMA's which are important short term moving averages, indicating negative bias in the short to medium term. Nifty continues to remain in an uptrend in the short and medium term, so buying on dips continues to be our preferred strategy. The daily strength indicator RSI and momentum oscillator Stochastic have both turned negative and are below their respective reference lines indicating negative bias The trend deciding level for the day is 10700. If NIFTY trades above this level then we may witness a further rally up to 10745-10830-10880 levels. However, if NIFTY trades below 10700 levels then we may see some profit booking initiating in the market, which may correct up to 10615-10565-10480 levels
Stocks to focus for intraday Long Mphasis, Gepil, OrientBank, RecLtd., HeritageFood, LTTS Stocks to focus for intraday Short Havells, Escorts,DivisLab Raymond, Hindalco, Bpcl,