Download
1 / 1
10 likes | 24 Views
Axis Direct presents daily derivatives report presenting recommendations based on technical analysis. For trading in derivatives visit https://simplehai.axisdirect.in/offerings/products/derivatives<br>https://simplehai.axisdirect.in/share-stock-prices/nse/Larsen-&-Toubro-Ltd-348<br>

E N D
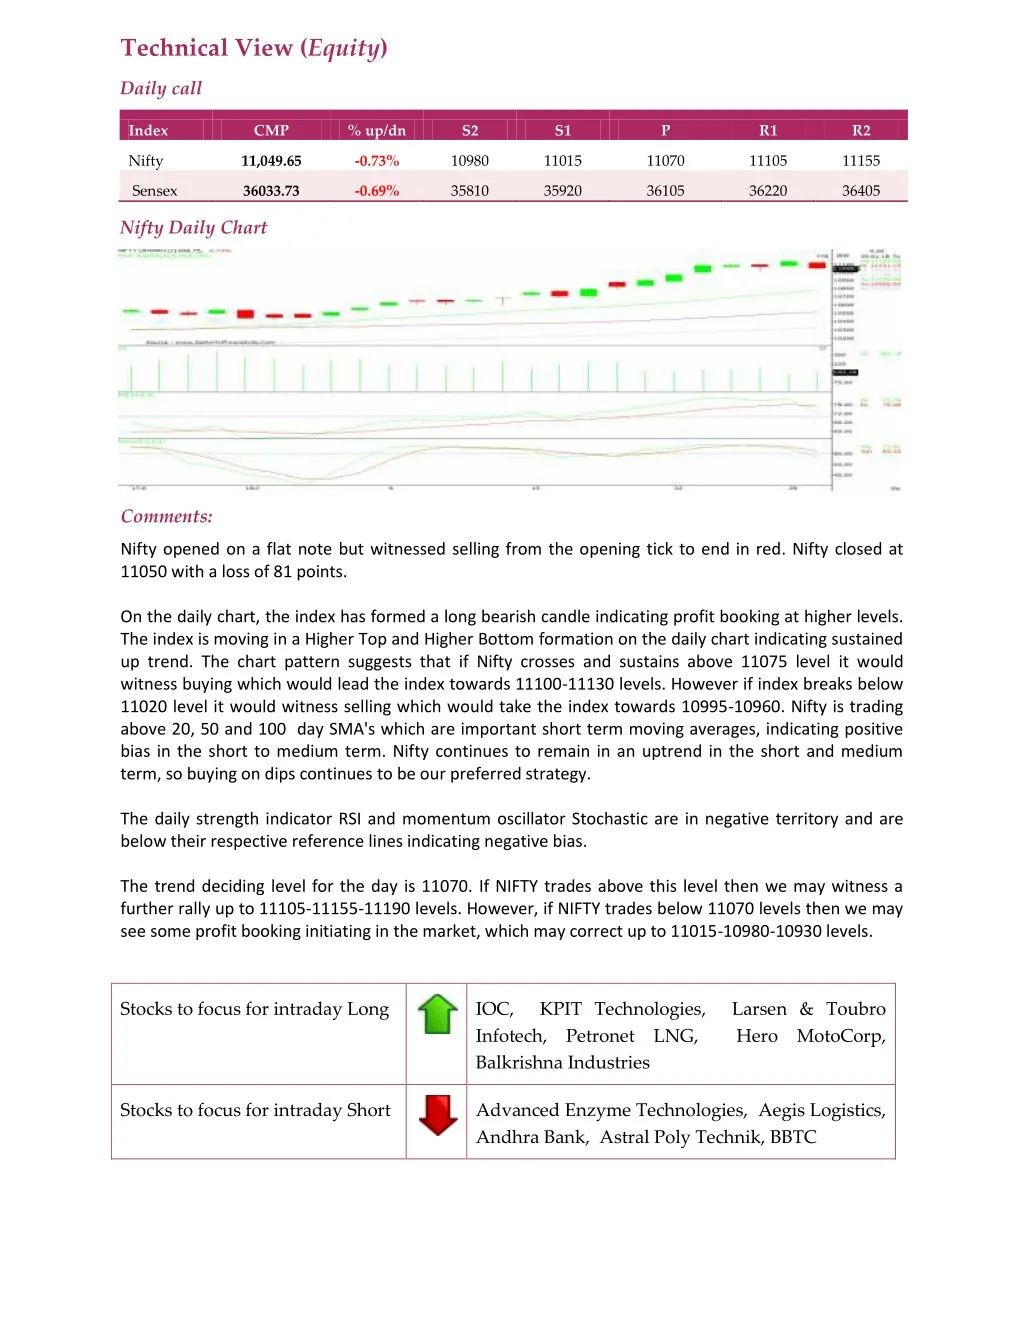
Technical View (Equity) Daily call Index CMP % up/dn S2 S1 P R1 R2 Nifty 11,049.65 -0.73% 10980 11015 11070 11105 11155 Sensex 36033.73 -0.69% 35810 35920 36105 36220 36405 Nifty Daily Chart Comments: Nifty opened on a flat note but witnessed selling from the opening tick to end in red. Nifty closed at 11050 with a loss of 81 points. On the daily chart, the index has formed a long bearish candle indicating profit booking at higher levels. The index is moving in a Higher Top and Higher Bottom formation on the daily chart indicating sustained up trend. The chart pattern suggests that if Nifty crosses and sustains above 11075 level it would witness buying which would lead the index towards 11100-11130 levels. However if index breaks below 11020 level it would witness selling which would take the index towards 10995-10960. Nifty is trading above 20, 50 and 100 day SMA's which are important short term moving averages, indicating positive bias in the short to medium term. Nifty continues to remain in an uptrend in the short and medium term, so buying on dips continues to be our preferred strategy. The daily strength indicator RSI and momentum oscillator Stochastic are in negative territory and are below their respective reference lines indicating negative bias. The trend deciding level for the day is 11070. If NIFTY trades above this level then we may witness a further rally up to 11105-11155-11190 levels. However, if NIFTY trades below 11070 levels then we may see some profit booking initiating in the market, which may correct up to 11015-10980-10930 levels. IOC, KPIT Technologies, Larsen & Toubro Infotech, Petronet LNG, Hero MotoCorp, Balkrishna Industries Stocks to focus for intraday Long Advanced Enzyme Technologies, Aegis Logistics, Andhra Bank, Astral Poly Technik, BBTC Stocks to focus for intraday Short