Download
1 / 2
20 likes | 23 Views
Axis Direct presents daily derivatives report presenting recommendations based on technical analysis. For trading in derivatives visit https://simplehai.axisdirect.in/offerings/products/derivatives

E N D
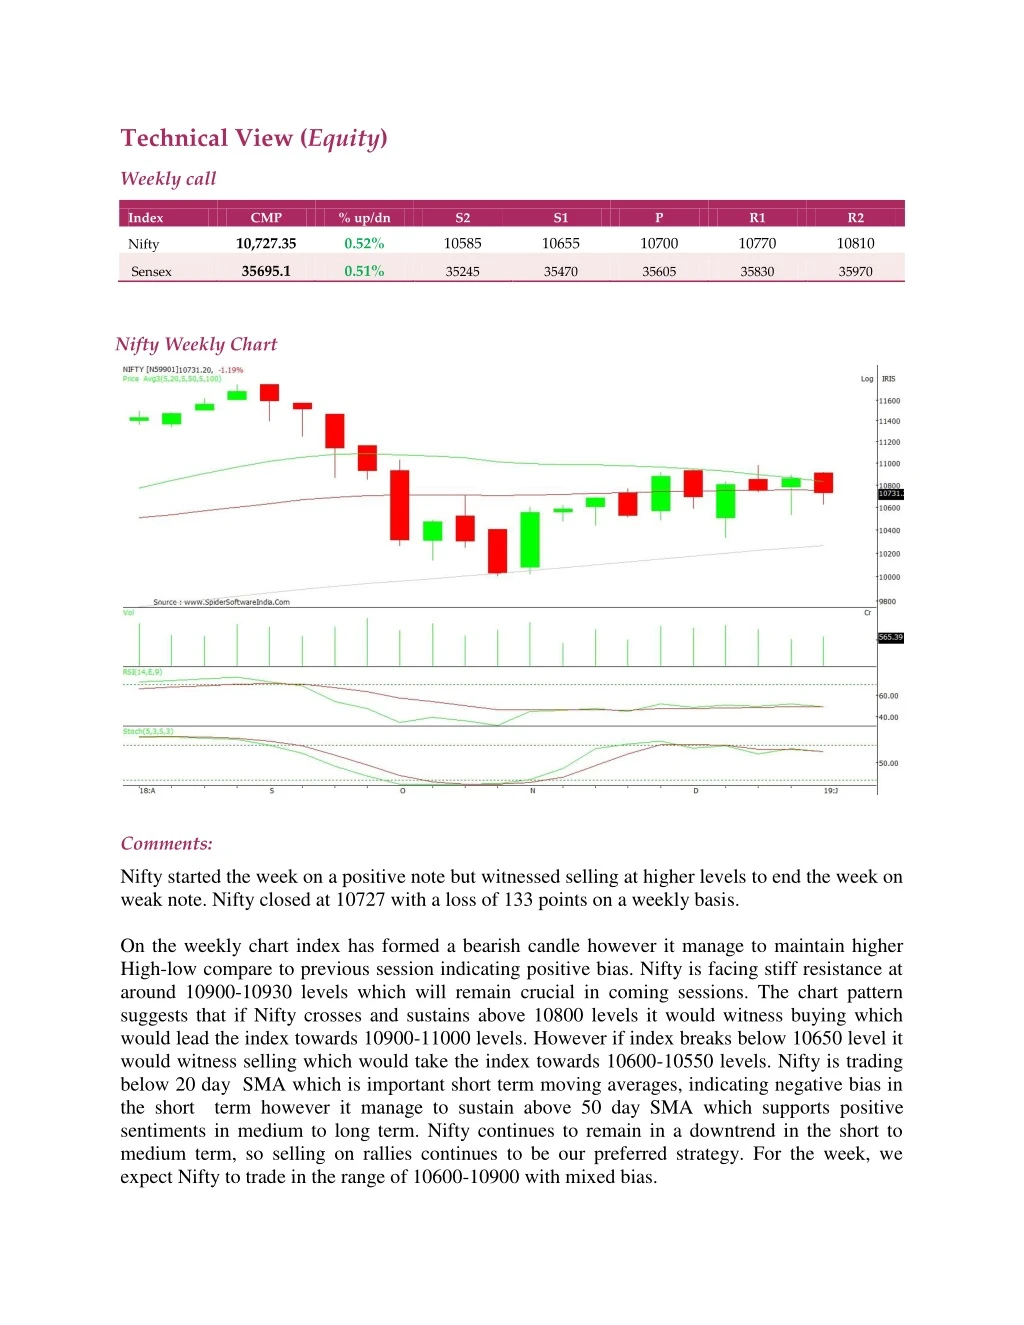
Technical View (Equity) Weekly call Index CMP % up/dn S2 S1 P R1 R2 10,727.35 0.52% 10585 10655 10700 10770 10810 Nifty 35695.1 0.51% Sensex 35245 35470 35605 35830 35970 Nifty Weekly Chart Comments: Nifty started the week on a positive note but witnessed selling at higher levels to end the week on weak note. Nifty closed at 10727 with a loss of 133 points on a weekly basis. On the weekly chart index has formed a bearish candle however it manage to maintain higher High-low compare to previous session indicating positive bias. Nifty is facing stiff resistance at around 10900-10930 levels which will remain crucial in coming sessions. The chart pattern suggests that if Nifty crosses and sustains above 10800 levels it would witness buying which would lead the index towards 10900-11000 levels. However if index breaks below 10650 level it would witness selling which would take the index towards 10600-10550 levels. Nifty is trading below 20 day SMA which is important short term moving averages, indicating negative bias in the short term however it manage to sustain above 50 day SMA which supports positive sentiments in medium to long term. Nifty continues to remain in a downtrend in the short to medium term, so selling on rallies continues to be our preferred strategy. For the week, we expect Nifty to trade in the range of 10600-10900 with mixed bias.
The weekly strength indicator RSI and momentum oscillator Stochastic both are moving flat indicating absence of strength on either side. The trend deciding level for the day is 10700. If NIFTY trades above this level then we may witness a further rally up to 10770-10810-10880 levels. However, if NIFTY trades below 10700 levels then we may see some profit booking initiating in the market, which may correct up to 10655-10585-10545 levels Stocks to focus for intraday Long Bhartiartl, Infratel, Tatamotors, Yesbank, Dcbbank Stocks to focus for intraday Short Bajfinance, Hcltech, Heromotoco, Indusindbk, Lt