Download
1 / 2
20 likes | 26 Views
Axis Direct presents daily derivatives report presenting recommendations based on technical analysis. For trading in derivatives visit https://simplehai.axisdirect.in/offerings/products/derivatives

E N D
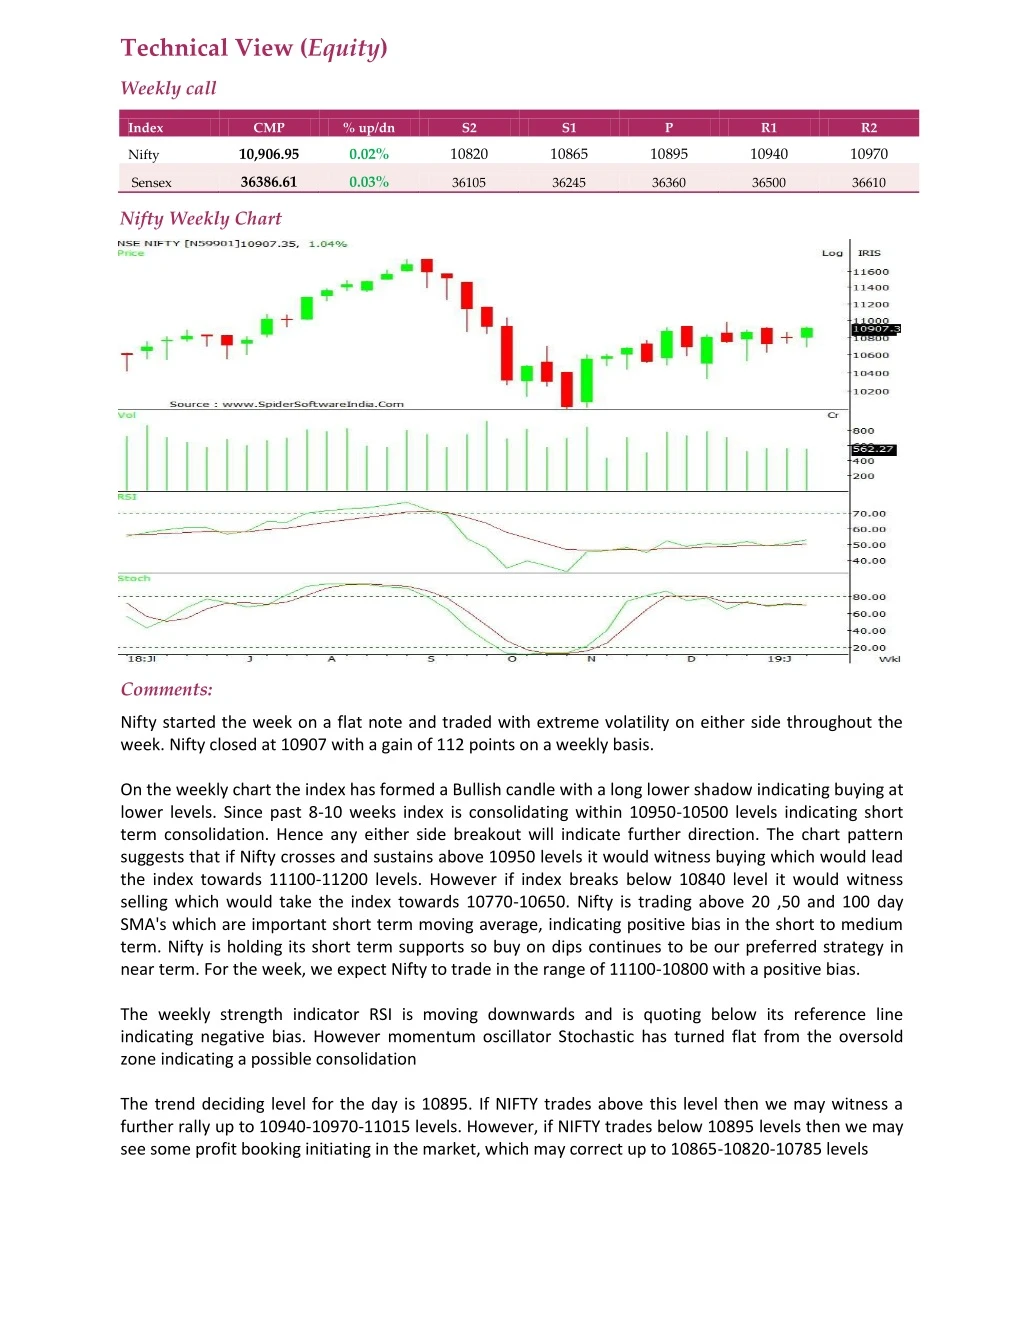
Technical View (Equity) Weekly call Index CMP % up/dn S2 S1 P R1 R2 10,906.95 0.02% 10820 10865 10895 10940 10970 Nifty 36386.61 0.03% Sensex 36105 36245 36360 36500 36610 Nifty Weekly Chart Comments: Nifty started the week on a flat note and traded with extreme volatility on either side throughout the week. Nifty closed at 10907 with a gain of 112 points on a weekly basis. On the weekly chart the index has formed a Bullish candle with a long lower shadow indicating buying at lower levels. Since past 8-10 weeks index is consolidating within 10950-10500 levels indicating short term consolidation. Hence any either side breakout will indicate further direction. The chart pattern suggests that if Nifty crosses and sustains above 10950 levels it would witness buying which would lead the index towards 11100-11200 levels. However if index breaks below 10840 level it would witness selling which would take the index towards 10770-10650. Nifty is trading above 20 ,50 and 100 day SMA's which are important short term moving average, indicating positive bias in the short to medium term. Nifty is holding its short term supports so buy on dips continues to be our preferred strategy in near term. For the week, we expect Nifty to trade in the range of 11100-10800 with a positive bias. The weekly strength indicator RSI is moving downwards and is quoting below its reference line indicating negative bias. However momentum oscillator Stochastic has turned flat from the oversold zone indicating a possible consolidation The trend deciding level for the day is 10895. If NIFTY trades above this level then we may witness a further rally up to 10940-10970-11015 levels. However, if NIFTY trades below 10895 levels then we may see some profit booking initiating in the market, which may correct up to 10865-10820-10785 levels
Stocks to focus for intraday Long Reliance, Wipro, Jkcement, Mindtree, KotakBank, HclTech Stocks to focus for intraday Short IRB, PEL,RelCap., Glenmark, Gail, Indigo, LIC, Union Bank, Wockpharma