Download
1 / 2
20 likes | 26 Views
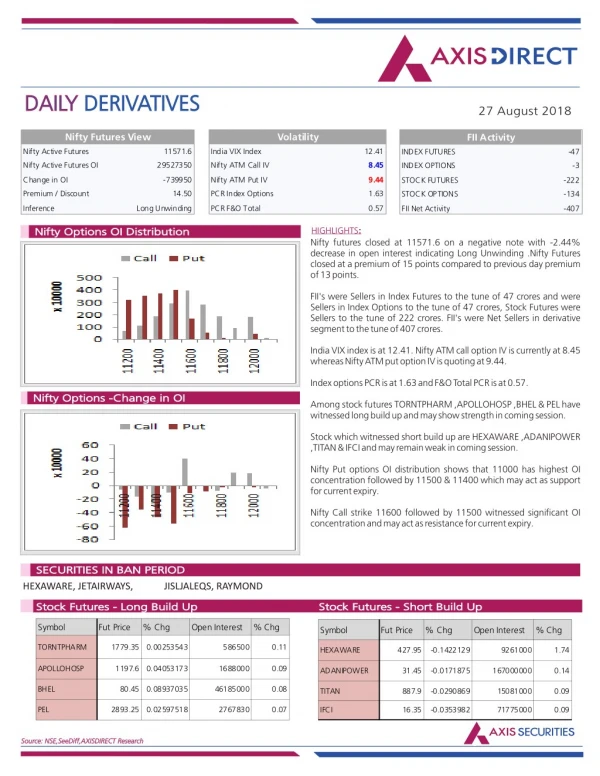
Axis Direct presents daily derivatives report presenting recommendations based on technical analysis. For trading in derivatives visit https://simplehai.axisdirect.in/offerings/products/derivatives

E N D
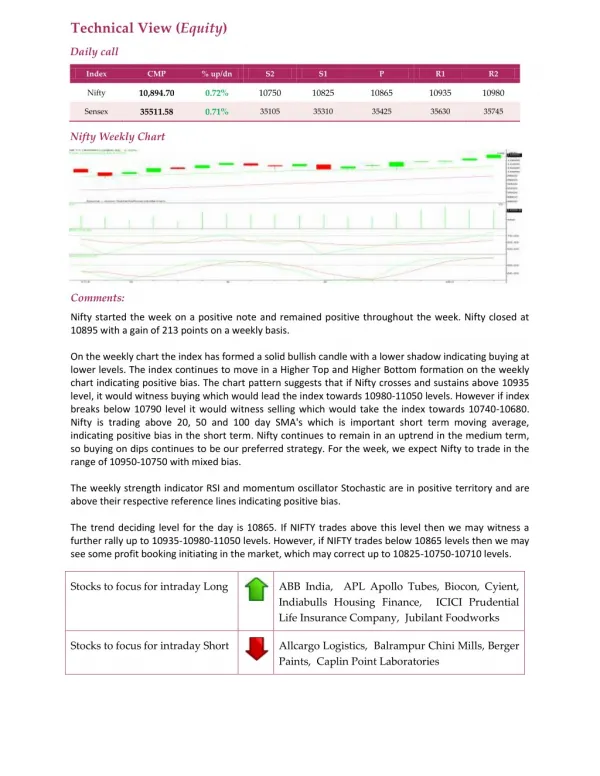
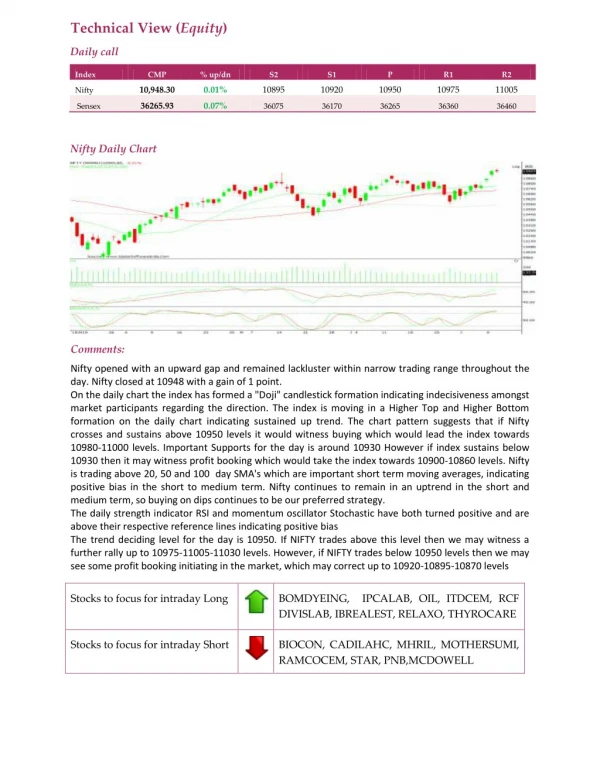
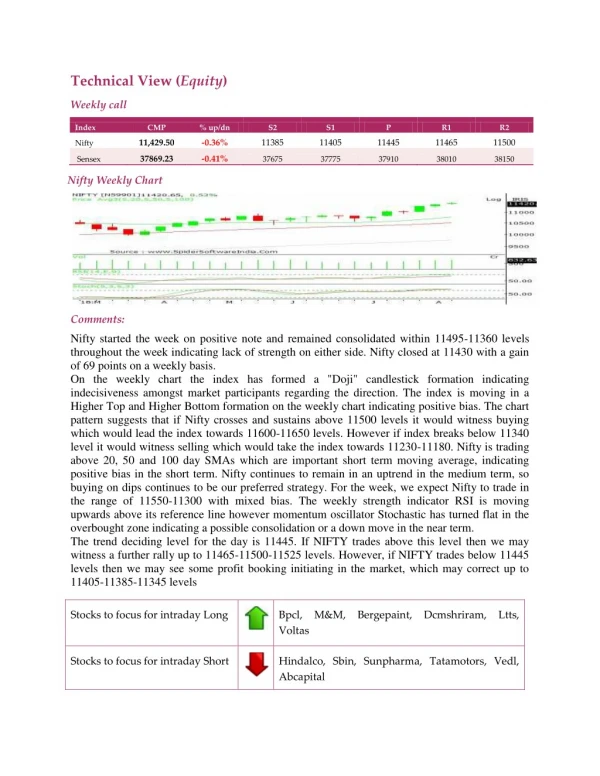
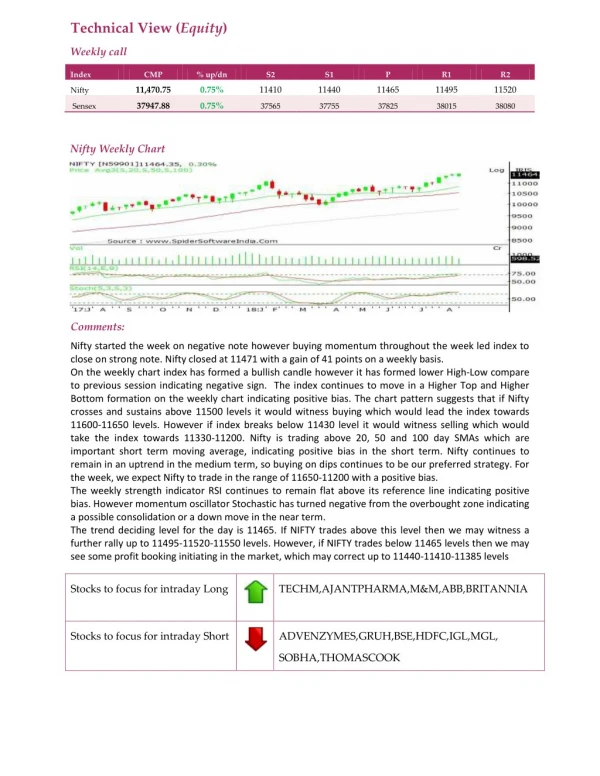
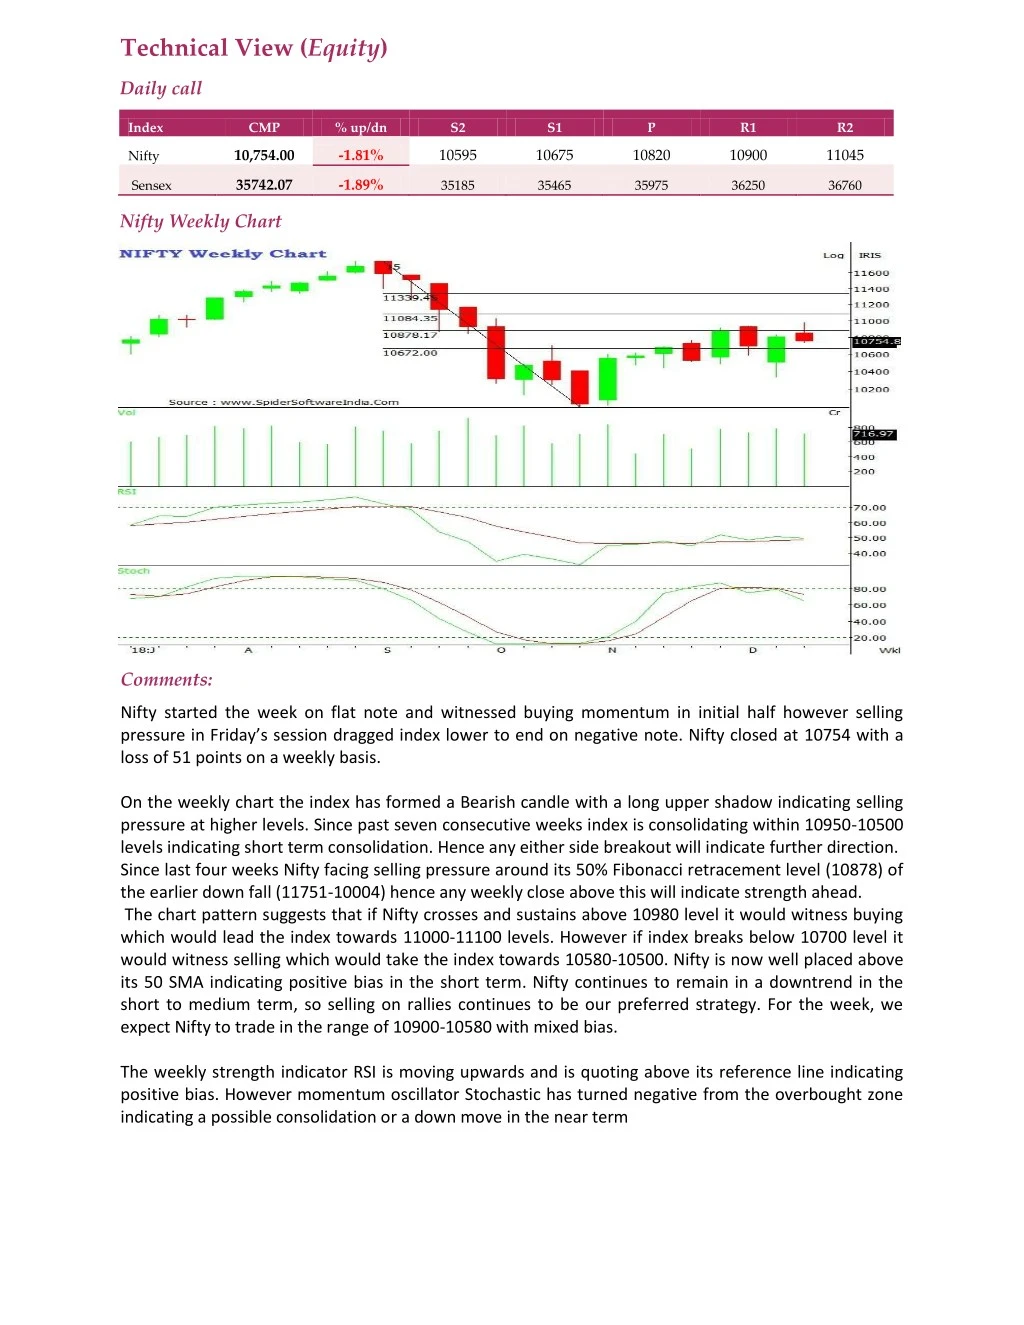
Technical View (Equity) Daily call Index CMP % up/dn S2 S1 P R1 R2 10,754.00 -1.81% 10595 10675 10820 10900 11045 Nifty 35742.07 -1.89% Sensex 35185 35465 35975 36250 36760 Nifty Weekly Chart Comments: Nifty started the week on flat note and witnessed buying momentum in initial half however selling pressure in Friday’s session dragged index lower to end on negative note. Nifty closed at 10754 with a loss of 51 points on a weekly basis. On the weekly chart the index has formed a Bearish candle with a long upper shadow indicating selling pressure at higher levels. Since past seven consecutive weeks index is consolidating within 10950-10500 levels indicating short term consolidation. Hence any either side breakout will indicate further direction. Since last four weeks Nifty facing selling pressure around its 50% Fibonacci retracement level (10878) of the earlier down fall (11751-10004) hence any weekly close above this will indicate strength ahead. The chart pattern suggests that if Nifty crosses and sustains above 10980 level it would witness buying which would lead the index towards 11000-11100 levels. However if index breaks below 10700 level it would witness selling which would take the index towards 10580-10500. Nifty is now well placed above its 50 SMA indicating positive bias in the short term. Nifty continues to remain in a downtrend in the short to medium term, so selling on rallies continues to be our preferred strategy. For the week, we expect Nifty to trade in the range of 10900-10580 with mixed bias. The weekly strength indicator RSI is moving upwards and is quoting above its reference line indicating positive bias. However momentum oscillator Stochastic has turned negative from the overbought zone indicating a possible consolidation or a down move in the near term
The trend deciding level for the day is 10820. If NIFTY trades above this level then we may witness a further rally up to 10900-11045-11125 levels. However, if NIFTY trades below 10820 levels then we may see some profit booking initiating in the market, which may correct up to 10675-10595-10450 levels Stocks to focus for intraday Long Tatasponge, Gruh, Fretail,VBL,Relinfra Stocks to focus for intraday Short UPL, Bharatforge,Zeel, Century Text, Reliance, Tcs, Mcdowell