Download
1 / 1
10 likes | 28 Views
Axis Direct presents daily derivatives report presenting recommendations based on technical analysis. For trading in derivatives visit https://simplehai.axisdirect.in/offerings/products/derivatives<br>https://simplehai.axisdirect.in/share-stock-prices/nse/DLF-Ltd-6890<br>https://simplehai.axisdirect.in/share-stock-prices/nse/Vedanta-Ltd-502<br>

E N D
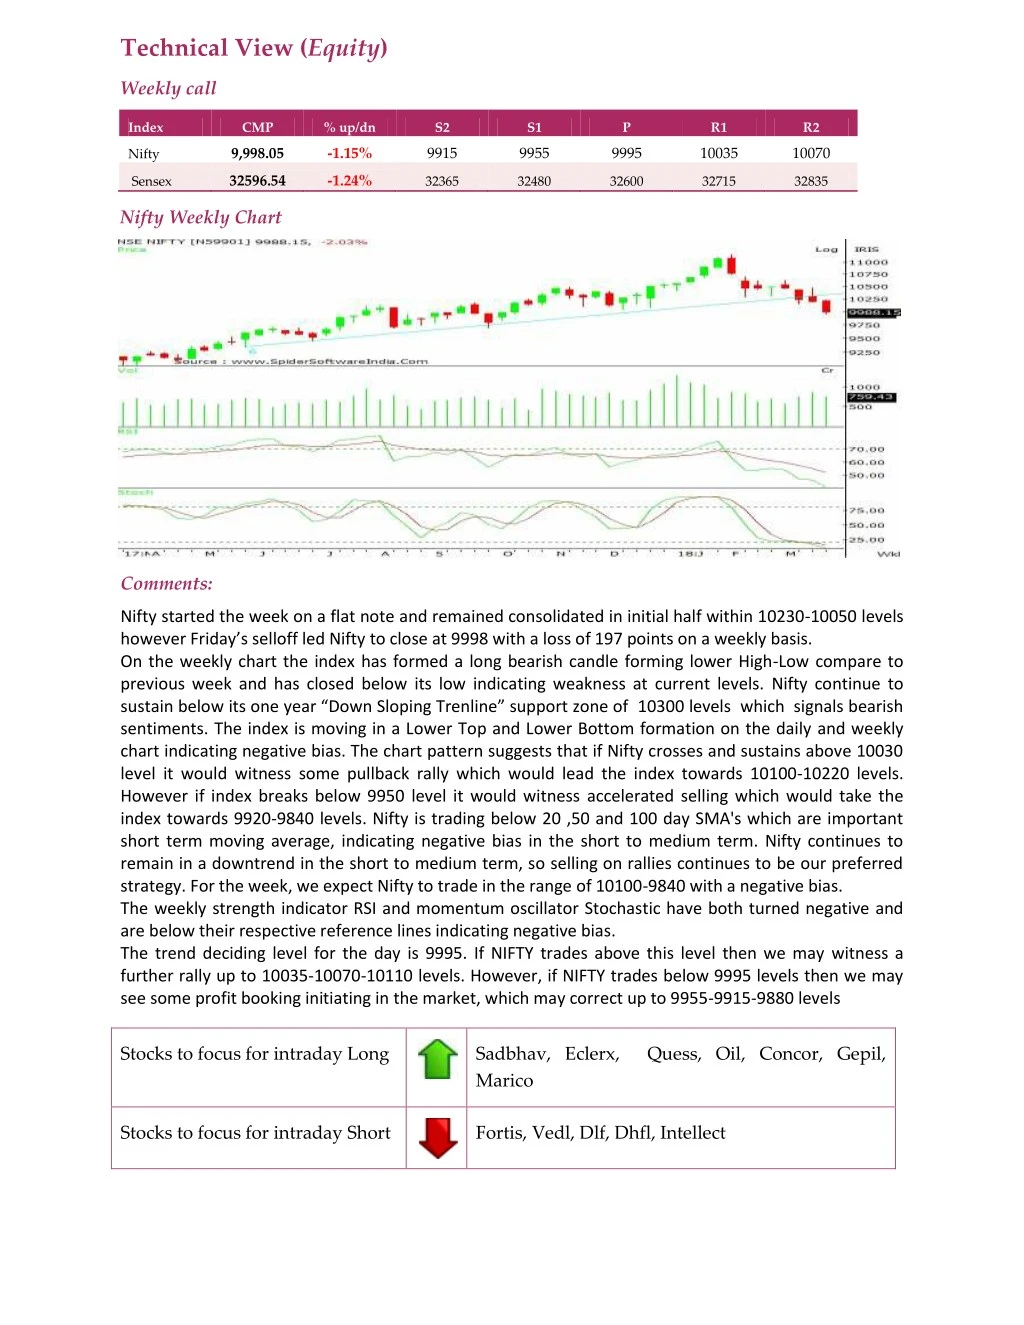
Technical View (Equity) Weekly call Index CMP % up/dn S2 S1 P R1 R2 9,998.05 -1.15% 9915 9955 9995 10035 10070 Nifty 32596.54 -1.24% Sensex 32365 32480 32600 32715 32835 Nifty Weekly Chart Comments: Nifty started the week on a flat note and remained consolidated in initial half within 10230-10050 levels however Friday’s selloff led Nifty to close at 9998 with a loss of 197 points on a weekly basis. On the weekly chart the index has formed a long bearish candle forming lower High-Low compare to previous week and has closed below its low indicating weakness at current levels. Nifty continue to sustain below its one year “Down Sloping Trenline” support zone of 10300 levels which signals bearish sentiments. The index is moving in a Lower Top and Lower Bottom formation on the daily and weekly chart indicating negative bias. The chart pattern suggests that if Nifty crosses and sustains above 10030 level it would witness some pullback rally which would lead the index towards 10100-10220 levels. However if index breaks below 9950 level it would witness accelerated selling which would take the index towards 9920-9840 levels. Nifty is trading below 20 ,50 and 100 day SMA's which are important short term moving average, indicating negative bias in the short to medium term. Nifty continues to remain in a downtrend in the short to medium term, so selling on rallies continues to be our preferred strategy. For the week, we expect Nifty to trade in the range of 10100-9840 with a negative bias. The weekly strength indicator RSI and momentum oscillator Stochastic have both turned negative and are below their respective reference lines indicating negative bias. The trend deciding level for the day is 9995. If NIFTY trades above this level then we may witness a further rally up to 10035-10070-10110 levels. However, if NIFTY trades below 9995 levels then we may see some profit booking initiating in the market, which may correct up to 9955-9915-9880 levels Stocks to focus for intraday Long Sadbhav, Eclerx, Quess, Oil, Concor, Gepil, Marico Stocks to focus for intraday Short Fortis, Vedl, Dlf, Dhfl, Intellect
