Download

1 / 42
420 likes | 717 Views
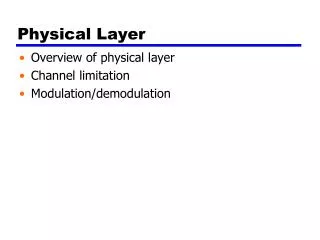
PART II. Physical Layer. Position of the physical layer. Services. Chapters. Chapter 3 Signals. Chapter 4 Digital Transmission. Chapter 5 Analog Transmission. Chapter 6 Multiplexing. Chapter 7 Transmission Media. Chapter 8 Circuit Switching and Telephone Network.

E N D
PART II Physical Layer
Chapters Chapter 3 Signals Chapter 4 Digital Transmission Chapter 5 Analog Transmission Chapter 6 Multiplexing Chapter 7 Transmission Media Chapter 8 Circuit Switching and Telephone Network Chapter 9 High Speed Digital Access
Chapter 3 Signals
To be transmitted, data must be transformed to electromagnetic signals Signals can be analog or digital. Analog signals can have an infinite number of values in a range; digital signals can have only a limited number of values.
In data communication, we commonly use periodic analog signals and aperiodic digital signals. Periodic signal completes a pattern within a measurable time frame, called a period, and repeats that pattern over subsequent identical periods. The completion of one full pattern is called a cycle. An aperiodic signal changes without exhibiting a pattern or cycle that repeats over time.
Analog signals can be simple or composite. Sine wave cannot be decomposed into simpler signals. A composite analog signal is composed of multiple sine waves. Peak amplitude of a signal represents the absolute value of its highest intensity, proportional to the energy it carries. Figure 3.2A sine wave
Period refers to the amount of time, in seconds, a signal needs to complete one cycle. Frequency refers to the number of periods in one second. Frequency and period are inverses of each other. Frequency is normally expressed in hertz (Hz). Figure 3.4Period and frequency
Example 1 Express a period of 100 ms in microseconds, and express the corresponding frequency in kilohertz. Solution From Table 3.1 we find the equivalent of 1 ms.We make the following substitutions: 100 ms = 100 10-3 s = 100 10-3 106ms = 105ms Now we use the inverse relationship to find the frequency, changing hertz to kilohertz 100 ms = 100 10-3 s = 10-1 s f = 1/10-1 Hz = 10 10-3 KHz = 10-2 KHz
Frequency is the rate of change with respect to time. Change in a short span of time means high frequency. Change over a long span of time means low frequency. If a signal does not change at all, its frequency is zero. If a signal changes instantaneously, its frequency is infinite. Phase describes the position of the waveform relative to time zero. When a signal changes instantaneously, its period is zero; since frequency is the inverse of period, the frequency is infinite. If a signal does not change at all, it never completes a cycle, so its frequency is 0 Hz Figure 3.5Relationships between different phases
Example 2 A sine wave is offset one-sixth of a cycle with respect to time zero. What is its phase in degrees and radians? Solution We know that one complete cycle is 360 degrees. Therefore, 1/6 cycle is (1/6) 360 = 60 degrees = 60 x 2p /360 rad = 1.046 rad
Time-domain plot shows changes in signal amplitude with respect to time. Phase and frequency are not explicitly measured on a time-domain plot. Frequency-domain plot shows the relationship between amplitude and frequency. An analog signal is best represented in the frequency domain. Figure 3.7Time and frequency domains
A single-frequency sine wave is not useful in data communications; we need to change one or more of its characteristics to make it useful When we change one or more characteristics of a single-frequency signal, it becomes a composite signal made of many frequencies According to Fourier analysis, any composite signal can be represented as a combination of simple sine waves with different frequencies, phases, and amplitudes
The bandwidth is a property of a medium: It is the difference between the highest and the lowest frequencies that the medium can satisfactorily pass In this book, we use the term bandwidth to refer to the property of a medium or the width of a single spectrum Figure 3.13Bandwidth
Example 3 If a periodic signal is decomposed into five sine waves with frequencies of 100, 300, 500, 700, and 900 Hz, what is the bandwidth? Draw the spectrum, assuming all components have a maximum amplitude of 10 V. Solution B = fh-fl = 900 - 100 = 800 Hz The spectrum has only five spikes, at 100, 300, 500, 700, and 900 (see Figure 13.4 )
Example 4 A signal has a bandwidth of 20 Hz. The highest frequency is 60 Hz. What is the lowest frequency? Draw the spectrum if the signal contains all integral frequencies of the same amplitude. Solution B = fh- fl 20 = 60 - fl fl = 60 - 20 = 40 Hz
Example 5 A signal has a spectrum with frequencies between 1000 and 2000 Hz (bandwidth of 1000 Hz). A medium can pass frequencies from 3000 to 4000 Hz (a bandwidth of 1000 Hz). Can this signal faithfully pass through this medium? Solution The answer is definitely no. Although the signal can have the same bandwidth (1000 Hz), the range does not overlap. The medium can only pass the frequencies between 3000 and 4000 Hz; the signal is totally lost.
1 can be encoded as a positive voltage and a 0 as zero voltage. Most digital signals are aperiodic, and thus period of frequency is not appropriate. Bit interval (instead of period) is the time required to send one single bit. Bit rate (instead of frequency) is the number of bit intervals per second. It is the number of bits sent in 1sec, usually expressed in bits per second (bps). Figure 3.16A digital signal
Example 6 A digital signal has a bit rate of 2000 bps. What is the duration of each bit (bit interval) Solution The bit interval is the inverse of the bit rate. Bit interval = 1/ 2000 s = 0.000500 s = 0.000500 x 10⁶ms = 500 ms
A digital signal is a composite signal with an infinite bandwidth The bit rate and the bandwidth are proportional to each other If we are sending analog data through a medium, we are concerned with analog bandwidth (expressed in hertz). If we are sending digital data through a medium, we are concerned with digital bandwidth (in bits per second). Analog bandwidth is the range of frequencies that a medium can pass. Digital bandwidth is the maximum bit rate that a medium can pass. Analog bandwidth of a medium is expressed in hertz; the digital bandwidth is expressed in bits per second.
Low pass channel has a bandwidth with frequencies between 0 and f. Lower limit is 0, the upper limit can be any frequency (including infinity) Band-pass channel has bandwidth with frequencies between f1 and f2. The analog bandwidth of a medium is expressed in hertz; the digital bandwidth, in bits per second Digital transmission needs a low-pass channel Analog transmission can use a band-pass channel Figure 3.19Low-pass and band-pass
Data rate limits Data rate depends on three factors: The bandwidth available The levels of signals we can use The quality of the signal (the level of the noise) Noiseless channel Nyquist Bit Rate defines the theoretical Maximum bit rate, BitRate = 2 * Bandwidth * log2L Bandwidth is the bandwidth of the channel L is the number of signal levels used to represent data BitRate is the bit rate in bits per second
Example 7 Consider a noiseless channel with a bandwidth of 3000 Hz transmitting a signal with two signal levels. The maximum bit rate can be calculated as BitRate = 2 3000 log2 2 = 6000 bps
Example 8 Consider the same noiseless channel, transmitting a signal with four signal levels (for each level, we send two bits). The maximum bit rate can be calculated as: Bit Rate = 2 x 3000 x log2 4 = 12,000 bps
Noisy Channel: Shannon Capacity To determine the theoretical digital highest data rate for a noisy channel Capacity = Bandwidth * log2(1+SNR) Bandwidth is the bandwidth of the channel SNR is the signal-to-noise ratio. Capacity is the capacity of the power of the signal to the power of the noise. Signal-to-noise ratio is the statistical ratio of the power of the signal to the power of the noise. There is no indication of the signal level, which means that no matter how many levels we use, we cannot achieve a data rate higher than the capacity of the channel. The formula defines a characteristic of the channel, not the method of transmission.
Example 9 Consider an extremely noisy channel in which the value of the signal-to-noise ratio is almost zero. In other words, the noise is so strong that the signal is faint. For this channel the capacity is calculated as C = B log2 (1 + SNR) = B log2 (1 + 0)= B log2 (1) = B 0 = 0
Example 10 We can calculate the theoretical highest bit rate of a regular telephone line. A telephone line normally has a bandwidth of 3000 Hz (300 Hz to 3300 Hz). The signal-to-noise ratio is usually 3162. For this channel the capacity is calculated as C = B log2 (1 + SNR) = 3000 log2 (1 + 3162) = 3000 log2 (3163) C = 3000 11.62 = 34,860 bps
Example 11 We have a channel with a 1 MHz bandwidth. The SNR for this channel is 63; what is the appropriate bit rate and signal level? Solution First, we use the Shannon formula to find our upper limit. C = B log2 (1 + SNR) = 106 log2 (1 + 63) = 106 log2 (64) = 6 Mbps Then we use the Nyquist formula to find the number of signal levels. 4 Mbps = 2 1 MHz log2L L = 4
Imperfections in the transmission media causes impairment in the signal. Attenuation means loss of energy. To compensate for this loss, amplifiers are used to amplify the signal. Decibel (dB) measures the relative strength of two signals or a signal at two different points. The decibel is negative if a signal is attenuated and positive if a signal is amplified. Figure 3.20Impairment types
Example 12 Imagine a signal travels through a transmission medium and its power is reduced to half. This means that P2 = 1/2 P1. In this case, the attenuation (loss of power) can be calculated as Solution 10 log10 (P2/P1) = 10 log10 (0.5P1/P1) = 10 log10 (0.5) = 10(–0.3) = –3 dB
Example 13 Imagine a signal travels through an amplifier and its power is increased ten times. This means that P2 = 10 ¥ P1. In this case, the amplification (gain of power) can be calculated as 10 log10 (P2/P1) = 10 log10 (10P1/P1) = 10 log10 (10) = 10 (1) = 10 dB
Example 14 One reason that engineers use the decibel to measure the changes in the strength of a signal is that decibel numbers can be added (or subtracted) when we are talking about several points instead of just two (cascading). In Figure 3.22 a signal travels a long distance from point 1 to point 4. The signal is attenuated by the time it reaches point 2. Between points 2 and 3, the signal is amplified. Again, between points 3 and 4, the signal is attenuated. We can find the resultant decibel for the signal just by adding the decibel measurements between each set of points.
Figure 3.22Example 14 dB = –3 + 7 – 3 = +1
Distortion means that the signal changes its form or shape. Distortion occurs in a composite signal, made of different frequencies. Each signal component has its own propagation speed through a medium and, therefore, its own delay in arriving at the final destination. Figure 3.23Distortion
Several types of noise such as thermal noise, induced noise, crosstalk and impulse noise may corrupt the signal. Thermal noise is the random motion of electrons in a wire which creates an extra signal not originally sent by the transmitter. Induced noise comes from sources such as motors and appliances. These devices act as a sending antenna and the transmission medium act as the receiving antenna. Crosstalk is the effect of one wire on the other. Impulse noise is a spike (a signal with high energy in a very short period of time) that comes from power lines, lightning, and so on. Figure 3.24Noise
Throughput is the measurement of how fast data can pass through an entity (such as a point or a network). Propagation speed measures the distance a signal or a bit can travel through a medium in one second. The propagation speed of electromagnetic signals depends on the medium and on the frequency of the signal. Figure 3.25Throughput
Propagation time measures the time required for a signal (or a bit) to travel from one point of the transmission medium to another. The propagation time is calculated by dividing the distance by the propagation speed. Figure 3.26Propagation time
Wavelength binds the period or the frequency of a simple sine wave to the propagation speed of the medium. Frequency is independent of the medium, but the wavelength depends on both the frequency and the medium. Wavelength = Propagation Speed * Period Figure 3.27Wavelength