Download
1 / 23
230 likes | 354 Views
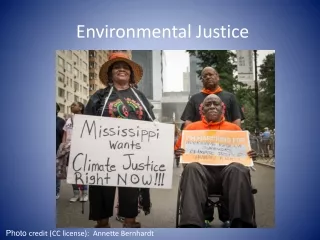
An overview of planning and environmental justice in Queensland. Jason Byrne jason.byrne@griffith.edu.au Aysin Dedekorkut Howes a.dedekorkut@griffith.edu.au. Overview. What is planning? Role of planning in environmental (in)justice What are the key issues? Who is affected? Two examples

E N D
An overview of planning and environmental justice in Queensland Jason Byrne jason.byrne@griffith.edu.au Aysin Dedekorkut Howes a.dedekorkut@griffith.edu.au
Overview • What is planning? • Role of planning in environmental (in)justice • What are the key issues? • Who is affected? • Two examples • Parks • Oil vulnerability • What might be done? Park sign on Pacific Coast Highway, L.A.
Land use planning defined • Future-oriented activity for creating and managing places • Guiding private land and property development • Directed towards state goals and objectives • Partly reflecting community aspirations • Ordering the use of land for ‘efficiency’ • Preventing land-use conflict • Minimising environmental impacts • Enhancing quality of life and amenity • Preventing avoidable deaths (e.g. sanitation) • Pursuing social welfare & equity
Three scales • Local land use planning (Council schemes) • Regional Planning (e.g. SEQ Region Plan) • State-wide strategic projects Two types • Statutory planning • Strategic planning
Land use Regulation Standards Scheme Zoning Strategy Policy Guideline Plan Vision Code Development control
So, what can planning do? • Guides future development and resource use • Anticipates development impacts and seeks to manage them • Seeks to prevent or minimise negative impacts • Notionally aims to achieve sustainability • Rationalises development patterns • Ensures minimum standards are met • e.g. drainage, building heights, road access, sewer connection, access to sunlight, overshadowing etc.
Environmental justice in Queensland • Planning has not responded well to environmental justice imperatives (risk management framework) • Other people’s business • Need to understanding who is vulnerable & to what • Who are they? • Where do they live? • What factors make them vulnerable? • Mapping vulnerable locations • Devising potential solutions • Modifying practices • Working with vulnerable people to devise responses
Vulnerability indicators Physical Social (after Cutter: 2006, 122-3) Female Female head of household Single parent Large number of dependents Unemployed Low education Homeless Low income Seasonal worker / service sector employee Migrant ‘Non-English speaker’ Very old & very young Renter (insecure tenure) Non-White Caravan or mobile home dweller Primary industry occupation Proximity to transport and medical services Disability Welfare dependent Asthmatic • Proximity to coastline • Height above sea level • Topography • Density of built form • Patterns of industrialisation • Location within floodplain • Proximity to dense vegetation • Age of building • Proximity to freeways • Proximity to airports • Access to green space • Distance to supermarkets
What were the historical issues? • Inner city contamination from heavy industry • Discrimination against Aboriginal people & spatial segregation • Lead petrol & lead paint • Dumping • Gasworks and petrochemical industries • Landfill sites & treatment plants • Light industrial areas
What are the current key issues? • Climate change impacts (e.g. heatwaves, flood, drought) • Food, water & energy security • Urban redevelopment / densification • Access to green space • Land contamination & asbestos exposure • Wild rivers • Mining (e.g. coal seam gas and uranium) • New port development • Remote Aboriginal communities • Public participation & cutting green tape
Causes/drivers • Intentional targeting (less likely – no evidence) • Land markets (seems to happen) • Unequal law enforcement (likely) • Biased decision-making (probably) • Limited public participation (definitely)
Roadblocks/impediments • Planning is reactive and not retrospective • Failure to recognise race/ethnicity/inequality • Legislative change is limiting powers further • Lack of consultation • Ministerial call-in powers circumventing process • Funding withdrawal from agencies • Expedited approvals: ‘open for business’ • Lack of recognition of EJ issues • Difficulty in accessing information • The dominance of hazards/risk rhetoric
Some big challenges for QLD planning • Coal seam gas • Contaminated sites • Climate change • Food & water security • Remote Aboriginal communities
Data problems • Availability of data • Cost of data acquisition and processing • Incomplete datasets • Poor record keeping • Scale of analysis (body, household, neighbourhood, region, state) • Silo approach to knowledge • Lack of agreed uniform measures • Issue with data custodians (e.g. Federal vs. state)
Findings on park distribution • National standard of 3 ha (7 acres) per 1,000 residents • Queensland has a generally accepted standard of 4 – 5 ha per 1,000 residents • Gold Coast has a desired standard of service for between 3.7 and 5.1 ha per 1,000 residents • We found Gold Coast has: • 2.3 ha / 1,000 for local parks • 0.81 ha / 1,000 for city parks • 0.5 ha / 1,000 for district parks • 0.84 ha / 1,000 for foreshore parks • 4.53 ha / 1,000 for all park types • Unequal distribution and poor accessibility by public transportation • Now DSS and contribution have been slashed
Evaluation of methods:Network vs. buffer • Cover different areas • Buffer exaggerates travel difference • Network accounts for street connectivity • Network more accurately depicts catchments • Both may miss informal paths / trails • Ground-truthing required 500m 800m 2500m
What might be done? • Changing planning schemes, ordinances and regulations (but not retrospective) • Upgrading building codes (Commonwealth issue) • Monitoring (other government departments) • New Laws (difficult in current political climate) • Citizen action (That’s what changed things in the USA) • Example of Chinese makers • Better integration & more power