Download
1 / 2
20 likes | 180 Views
S3D on Intrepid. Weak scaling experiments performed on 1,4,8,64,512,1728,4096,6400,8000 and 12000 cores 30000 core experiment pending All Experiments performed in VN mode TAU Profile data collected for time only Instrumentation overhead <5% to ~20%

E N D
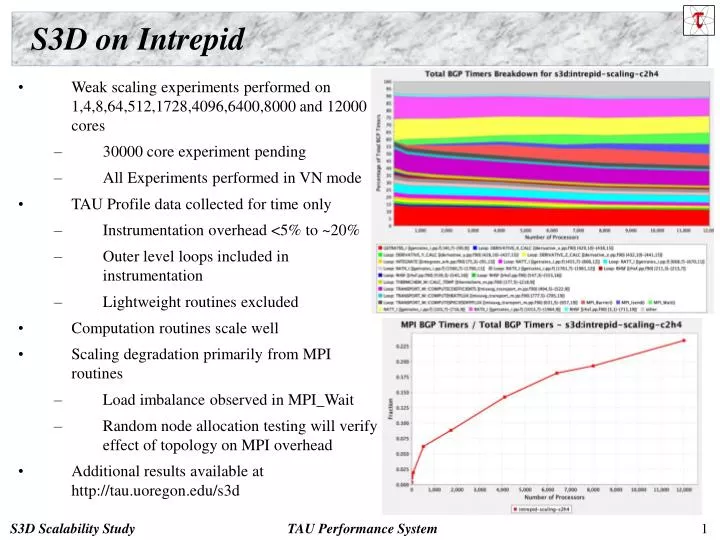
S3D on Intrepid • Weak scaling experiments performed on 1,4,8,64,512,1728,4096,6400,8000 and 12000 cores • 30000 core experiment pending • All Experiments performed in VN mode • TAU Profile data collected for time only • Instrumentation overhead <5% to ~20% • Outer level loops included in instrumentation • Lightweight routines excluded • Computation routines scale well • Scaling degradation primarily from MPI routines • Load imbalance observed in MPI_Wait • Random node allocation testing will verify effect of topology on MPI overhead • Additional results available at http://tau.uoregon.edu/s3d
S3D on Jaguar 1 RATT_I 2 RHSF 3 RATX_I 4 COMPUTECOEFFICIENTS 5 COMPUTESPECIESDIFFFLUX 6 MPI_Wait 7 INTEGRATE 8 CALC_TEMP 9 COMPUTEHEATFLUX 10 DERIVATIVE_X_CALC 11 DERIVATIVE_Y_CALC 12 DERIVATIVE_Z_CALC 13 DERIVATIVE_X_COMM • Detailed event-based performance measurements: IPC, FLOPS, Control transfer-related measurements; Memory measurements: L1 Data & Instruction, L2, TLB, L3 • L3 cache behavior for different core cases: 4 cores (VNM) versus 1 core per node (SMP) Total Runtime jaguar: VNM: 813 s SMP: 613.4 s Total Runtime BGP: VNM: 3005.74 s SMP: 3014.55 s • L3 serves as victim cache for L2: if data is not in L2, L2 TLB checks L3 ( L3 request) Based on this workflow: Why does number of L3 requests and misses increase so dramatically in VNM on jaguar?