Download

1 / 13
130 likes | 388 Views
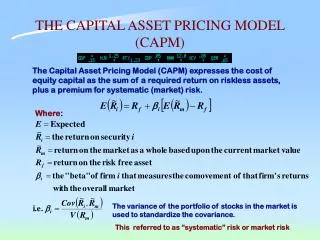
The Capital Asset Pricing Model. P.V. Viswanath Based on Damodaran’s Corporate Finance. Equilibrium Prices in Capital Markets.

E N D
The Capital Asset Pricing Model P.V. Viswanath Based on Damodaran’s Corporate Finance
Equilibrium Prices in Capital Markets • Earlier we discussed how to construct an optimal portfolio assuming that we had estimates of expected rates of return and the standard deviations of rates of returns on different assets. • However, if everybody behaved according to those rules of portfolio formation, the rules of demand and supply imply certain restrictions on average rates of return. • We will look at this now. P.V. Viswanath
Assumptions of the CAPM • The CAPM makes various assumptions: • Investors make their decisions based solely on the expected returns and variances of portfolio returns. • No transactions costs and no personal income taxes. • Assets are infinitely divisible. • Perfect competition--an individual cannot affect the price of a asset by his/her buying or selling. • All assets, including human capital, are marketable. • All investors have the same information. • Unlimited short sales are allowed. • Unlimited lending and borrowing is permitted at the riskless rate. P.V. Viswanath
The Market Portfolio • If each individual had the same information and each individual used mean-variance analysis to make portfolio decisions, each individual would face the same efficient frontier of risky assets. • We saw that this means that each individual would face the same tangent portfolio of risky assets. • However each person could hold different combinations of this tangent portfolio and the risk-free asset. • This implies, however, that the common tangent portfolio has to be the risky portfolio of all assets, which we call the market portfolio. P.V. Viswanath
Efficient Frontier with Many Risky Assets and a Risk-free Asset P.V. Viswanath
Implications of the CAPM • If all investors’ risky portfolio is the market portfolio, the only risk is that derived from holding the market portfolio. • The risk-return trade-off, furthermore, is easily seen to be given by the slope of the efficient frontier. • This is called the capital-market line and it’s equation is given by: • The rate of return on an individual’s optimal portfolio holdings in equilibrium equals the risk-free rate (the first term) plus a compensation for the risk (s) of the portfolio (second term). P.V. Viswanath
The risk premium on the market portfolio • We see that the compensation per unit of standard deviation risk borne by an individual in his portfolio is [E(Rm)-Rf]/sm. • This is precisely the slope of the capital market line and can be understood as the trade-off between risk compensation and risk. • The numerator in this expression is the compensation for risk for one who holds the market portfolio and is simply the extra average return that s/he gets over and above the risk-free rate, which is simply the return for delaying consumption. P.V. Viswanath
Determinants of the risk premium • This market risk premium is determined by several factors: • The average risk aversion of investors – the greater the risk aversion, the greater the risk premium. • The expected productivity of the capital stock – the higher the productivity, the greater the risk premium (because the expected return on the market portfolio will be higher) • The willingness to wait to consume – the lower the willingness to wait, the higher the riskfree rate and the lower the risk premium P.V. Viswanath
Riskiness of individual assets • The capital market line represents the location of the entire portfolios of investors. • The capital market line equation, therefore, represents the equilibrium expected return on these entire portfolios. • We know, furthermore, that individual assets will not be on the capital market line, but rather below the line. • Hence, the capital market line will not give us the expected equilibrium return on individual assets. P.V. Viswanath
Riskiness of individual assets • Individual assets will be considered risky to the extent that they add to the risk of the market portfolio. • An asset whose payoff is entirely uncorrelated with the market portfolio is not considered risky at all because investors holding the market portfolio will be able to diversify the uncertainty of that asset by holding the market portfolio. • The measure of riskiness of an asset is given by its beta, bj = sjm/sM2. • The equilibrium expected return on a single asset is given by the equation: E(rj) = rf + bj E(Rm)-Rf] P.V. Viswanath
Asset betas • An asset’s beta measures the extent to which it moves with the market portfolio. • The beta is standardized so that the beta of the market equals one. • Consequently, assets that react more (less) than proportionately to market movements have betas greater (less) than one. • The beta of an asset can be measured by regressing the total return on that asset against the total return on the market portfolio. • Diversified portfolios, such as the S&P 500 or the portfolio of all exchange-traded stocks are often used as proxies for the market portfolio. P.V. Viswanath
The CAPM in Portfolio Selection • Since the market portfolio is efficient, the optimal strategy for an investor who does not have information that other investors don’t have is simply to hold his/her money in the market portfolio and a portfolio of low-risk Treasury securities. • Even an investor who believes that s/he has special information should ensure that his/her portfolio is not unduly diversified, in taking advantage of the special information. • The investor should take his/her non-traded assets (such as human capital) in choosing the traded portfolio. • Hence somebody working in the banking sector should hold fewer banking stocks since his/her total portfolio already has exposure to the banking sector (his/her potential to earn is likely to move with banking stocks). P.V. Viswanath
The CAPM in Capital Budgeting • Since financial resources are finite, there is a hurdle that corporate projects have to cross before being deemed acceptable. • This hurdle will be higher for riskier projects than for safer projects. • A simple representation of the hurdle rate is as follows: Hurdle rate = Return for postponing consumption + Return for bearing risk Hurdle rate = Riskless Rate + Risk Premium • The CAPM says that the hurdle rate for a project, k, depends on its beta. Hence if that project’s beta is bk , its required return or hurdle rate is equal to the sum of the risk-free rate and bk times the market risk-premium: • Required ROR = Riskfree rate + bk (Market Risk Premium) • Required ROR = Rf + bk(E(Rm) - Rf) P.V. Viswanath