Download
1 / 25
650 likes | 1.55k Views
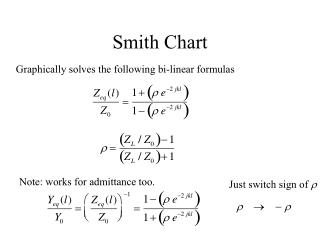
The Smith Chart. Developed in 1939 by P. W. Smith as a graphical tool to analyze and design transmission-line circuits Today, it is used to characterize the performance of microwave circuits. Complex Plane. Smith Chart Parametric Equations. Equation for a circle.

E N D
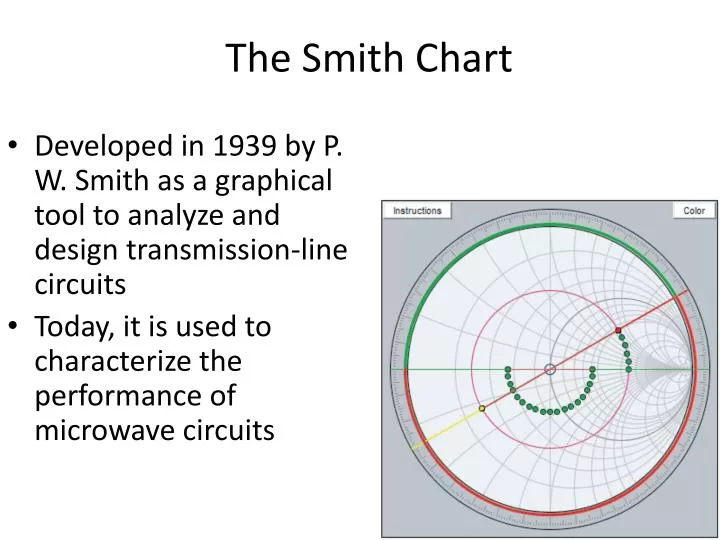
The Smith Chart Developed in 1939 by P. W. Smith as a graphical tool to analyze and design transmission-line circuits Today, it is used to characterize the performance of microwave circuits
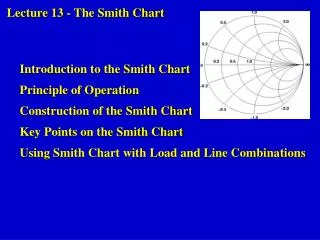
Smith Chart Parametric Equations Equation for a circle
Smith Chart Parametric Equations rL circles rL circles are contained inside the unit circle xL circles Only parts of the xL circles are contained within the unit circle
Complete Smith Chart Positive xL Circles rL Circles Negative xLCircles
Input Impedance Constant SWR circle (standing-wave ratio)
(c) (d) (a) (b)
Given: S = 3 Z0 = 50 Ω first voltage min @ 5 cm from load Distance between adjacent minima = 20 cm Determine: ZL λ/2 = 20
Lumped-Element Matching Choose d and Ys to achieve a match at MM’
Transients Rectangular pulse is equivalent to the sum of two step functions
Transient Response Initial current and voltage Reflection at the load Load reflection coefficient Second transient Generator reflection coefficient
Voltage Wave T = l/upis the time it takes the wave to travel the full length of the line
Current Wave Reflection coefficient for current is the negative of that for voltage