Download
1 / 28
280 likes | 356 Views
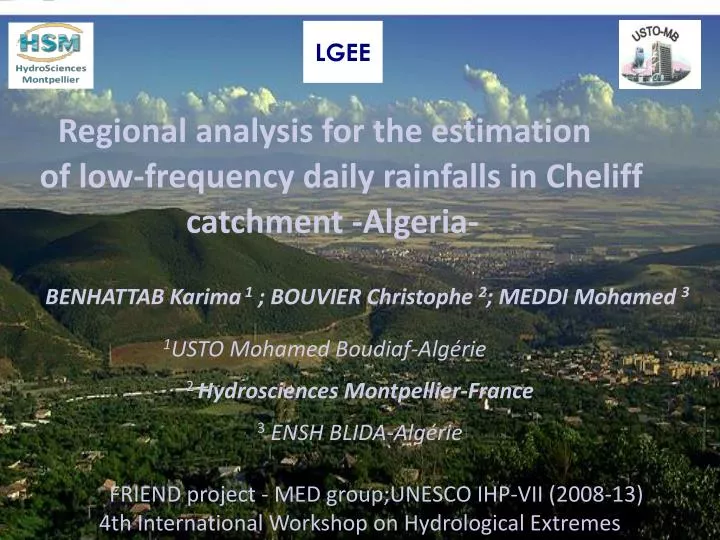
Regional analysis for the estimation of low-frequency daily rainfalls in Cheliff catchment -Algeria- BENHATTAB Karima 1 ; BOUVIER Christophe 2 ; MEDDI Mohamed 3 1 USTO Mohamed Boudiaf-Algérie

E N D
Regional analysis for the estimation of low-frequency daily rainfalls in Cheliff catchment -Algeria- BENHATTAB Karima 1 ; BOUVIER Christophe 2; MEDDI Mohamed 3 1USTO Mohamed Boudiaf-Algérie 2 Hydrosciences Montpellier-France 3ENSH BLIDA-Algérie FRIEND project - MED group;UNESCO IHP-VII (2008-13) 4th International Workshop on Hydrological Extremes 15 september 2011 LGEE
Introduction • Sizing of minor hydraulic structures is based on design Rainfall quantiles (QT) of medium to high return periods (T). • If the length of the available data series is shorter than the T of interest, or when the site of interest is ungauged (no flow data available) obtaining a satisfactory estimate of QT is difficult. Regional flood Frequency analysis is one of the approaches that can be used in such situations.
The Cheliff watershed, Algeria 1800 m asl 0 m asl Algeria Oued Chlef 0 60 km 46 rainfall stations located in the northern part of the basin: daily rainfalls records from 1968 to 2004
Mean annual rainfall 1968-2004(mm) The Cheliff watershed, Algeria 1800 m asl 0 m asl Oued Chlef 0 60 km 2 main topographic regions : valley and hillslopes ; influence on mean annual rainfall
Why L-moment approach? • Able to characterize a wider range of distributions • Represent an alternative set of scale and shape statistics of a data sample or a probability distribution. • Less subject to bias in estimation • More robust to the presence of outliers in the data
Brief Intro to L-Moments Hosking [1986, 1990] defined L-moments to be linear combinations of probability-weighted moments: Let x1 x2 x3 be ordered sample . Define
Estimating L-moments where then the L-moments can be estimated as follows: lb0 l22b1 - b0 l36b2 - 6b1+ b0 420b3 - 30b2 + 12 b1 - b0 L-CV = l2/ l1 (coefficient of L-variation) t3 = l3/ l2 (L-skewness) t4 = l4/ l2 (L-kurtosis)
Regional L-Moment ratios Weighted Standard deviation of at site LCV´s Simulation 500 Fit a distributionto Calculate v1, v2, v3…….v500 Heterogeneity test(H) H : is the discrepancy between L-Moments of observed samples and L-Moments of simulated samles Assessed in a series of Monte Carlo simulation : H?
Heterogeneity test(H) The performance of H was Assessed in a series of Monte Carlo simulation experiments: H2 : Region is definitely heterogeneous. 1 ≤H<2: Region is possiblyheterogeneous . H<1:Region is acceptably homogeneous.
Delineation of homogeneous groups H<1 Dendrogram presenting clusters of rainfall originated in Cheliff basin
H>1 ! Delineation of homogeneous groups Dendrogram presenting clusters of rainfall originated in Cheliff basin
H<1 Delineation of homogeneous groups Dendrogram presenting clusters of rainfall originated in Cheliff basin
Delineation of homogeneous groups Group1 Group2 Group3 Dendrogram presenting clusters of rainfall originated in Cheliff basin
Group1 Group2 Group3 Clusters pooling The stations located in the valleys correspond to the group 1 (downstream valley) or 3 (upstream valleys) whereas stations located on the hillslopes correspond to the group 2. 0 60 km
What is the appropriate Distribution? t4(L-Kurtosis) t3 (L-Skewness) Estimation of the regional frequency distribution Hypothesis The L-moment ratio diagram
Estimation of the regional frequency distribution LCs–LCk moment ratio diagram for group 1.
Estimation of the regional frequency distribution LCs–LCk moment ratio diagram for group 2.
Estimation of the regional frequency distribution LCs–LCk moment ratio diagram for group 3.
The goodness-of-fit measure ZDist “Dist” refers to the candidate distribution, τ4 DISTis the average L-Kurtosis value computed from simulation for a fitted distribution. τ4is the average L-Kurtosis value computed from the data of a given region, β4is the bias of the regional average sample L-Kurtosis, σvis standard deviation. A given distribution is declared a good fit if|ZDist|≤1.64
Estimation of precipitation quantiles Generalized Extreme Value (GEV) distribution Quantile is the inverse : k= shape; = scale, ξ = location
Estimation of precipitation quantiles Regional Estimation Local Estimation
Bougara Station Ain Lelloul The regional and at-site annual rainfall group 1 At-site and regional cumulative distribution functions (CDFs) for one representative station at each group
The regional and at-site annual rainfall group 2 Tissemsilt station Teniet El Had station we observe a reasonable underestimation or overestimation of quantiles estimated for the high return periods .
Reliability of the regional approach group1 The values of RMSE is greater and the discrepancy is growing when T> 100 years.
Conclusions and Recommendations • the regional approach proposed in this study is quite robust and well indicated for the estimation of extreme storm events; • L-moments analysis is a promising technique for quantifying precipitation distributions; • L-Moments should be compared with other methods (data aggregation for example).