Download
1 / 20
200 likes | 363 Views
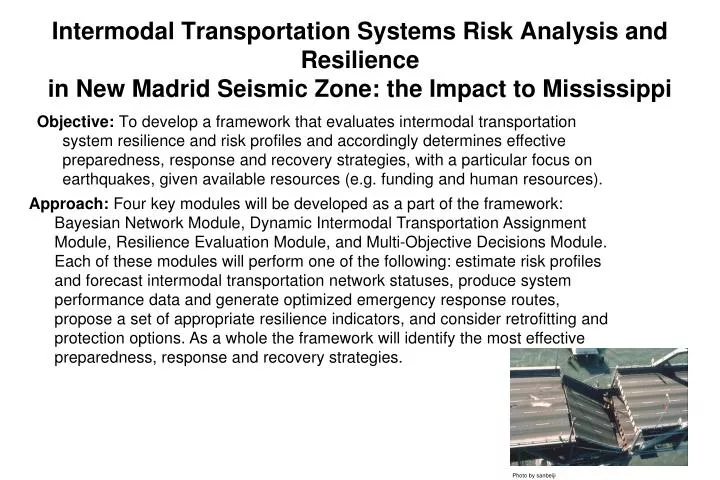
Intermodal Transportation Systems Risk Analysis and Resilience in New Madrid Seismic Zone: the Impact to Mississippi.

E N D
Intermodal Transportation Systems Risk Analysis and Resilience in New Madrid Seismic Zone: the Impact to Mississippi • Objective: Todevelopa framework that evaluates intermodal transportation system resilience and risk profiles and accordingly determines effective preparedness, response and recovery strategies, with a particular focus on earthquakes, given available resources (e.g. funding and human resources). • Approach: Four key modules will be developed as a part of the framework: Bayesian Network Module, Dynamic Intermodal Transportation Assignment Module, Resilience Evaluation Module, and Multi-Objective Decisions Module. Each of these modules will perform one of the following: estimate risk profiles and forecast intermodal transportation network statuses, produce system performance data and generate optimized emergency response routes, propose a set of appropriate resilience indicators, and consider retrofitting and protection options. As a whole the framework will identify the most effective preparedness, response and recovery strategies. Photo by sanbeiji
Real – Time Identification and Monitoring of Barge-Carried Hazardous Commodities Objective: To analyze multiple algorithms in order to improve the model efficiency. Background: Phase I and Phase II were completed in which the scope of the project was determined and the model was developed. Running Time: The running time data was analyzed using multiple algorithms including average vs. actual, trajectory methods, linear regression (MatLab), and neural networks (MatLab). The best results at this point are the result of a one layer, nine neuron neural network with a 19% MAE with an approximate 5 minute accuracy. Dwell Time: The dwell time data was statistically analyzed to determine predictability. As a result of the analysis it was concluded that the dwell was not predictable. Future Research: In the future more algorithms will be tested including K-NN, linear regression (Excel), and time-series neural networks. Data with shorter time intervals between entries will try to be acquired to improve accuracy.
I-55 Integrated Diversion Traffic Management Benefit Study Objective: Evaluating the benefits of freeway congestion relief by utilizing corridor-wide capacity in an integrated way. Case Study in Jackson MS • Base Scenario • No rerouting no matter how congested the freeway is. • Rerouting Only Scenario • VMS is implemented but no signal optimization. • Signal Optimization Scenario • In addition to rerouting, the traffic signals on arterial road are optimized.
Intersection Queue Management Plan Based on Video Detection System Background Significant different queue lengths of major and minor streets of an intersection, in/out bounds, especially during rush hour and special events, provide rooms for reducing control delay of an intersection Current Intersection Queue Management Plans Static Plan: Switch to Max G 2 for phase with long queue approaches in a period of time Dynamic Plan: Dynamic Max G 2: uses Max G 2 on a cycle base Dynamic Passage Time Adjustment: revise gap time of current phase to 0 when needed Dynamic Max G 2 & Passage Time Adjustment Limited by Coordination (Not considered now) Objective Proposed an intersection queue management plan to reduce overall interaction control delays based on video detection system (VDS) (Version 1) Proposed an intersection queue management plan to reduce overall interaction fuel consumption/emission based on video detection system (VDS) (Version 2) Results: The best scenario reduces 13.33 % of intersection control delay On average, the dynamic plans have better performance than static plan The proposed simple queue management plan is effective
Modeling Modal Shift and Dynamic Traffic Assignment in Intermodal Transportation Systems Introduction - TransCAD has non-negligible limitations on modal shift and traffic assignment when modeling the demand inability of incorporating fuel consumption and emission Lack of intermodal transportation modeling Limited traffic assignment functions System Framework Objective: Develop a framework that integrates fuel consumption, emission, multimodal transportation planning, and DTA to address the limitations of existing transportation planning tools in modeling modal shifts and traffic assignment in intermodal transportation. Benefits Forecasting travel demand for the model sensitive to fuel consumption and. emission Helping government agencies to balance the development of different modes Assessing the influence of an environmental policy on travel demands and mode choices
FRAMEWORK OF CALCULATING THE MEASURES OF RESILIENCE (MOR) FORINTERMODAL TRANSPORTATION SYSTEMS Case Study: the Gulf Coast Region in Mississippi during Hurricane Katrina Objective: to develop a framework of calculating the measure of resilience for intermodal transportation systems and to propose, as well as evaluate, strategies for improving the MOR. • Intermodal Transportation Systems Resilience Indicators 1) Highway Network • Mobility • Average Truck Trip Length • Average Travel Time per Mile • Mobility Performance Index • Accessibility • Percentage of Open Highway • Percentage of Truck Traveled under 85th Percentile of Speed Limit • Reliability • Average Delay Per Truck Trip • Level of Service 2) Intermodal Terminals • Level of Service • Results • Initial system breakdown after Hurricane Katrina was quickly restored • The intermodal transportation systems of the study area demonstrated fairly good system wide resilience to Hurricane Katrina • Showed local congestions on highway • Freeway Ramps/Major Arterials • During the Peak hours • Re-routing/re-distributing the traffic alleviates the congestions
Real-time Transit Vehicle Routing Optimization in Emergency Evacuations System Framework Background Nature disaster caused catastrophic losses of lives and properties due to the inability of conducting real-time transit evacuation operations in a dynamic environment. Current fleet management software, such as RouteMatch, SafePath, can’t handle real-time evacuation operations that face a dyamic environment. Benefits Improving the transit system efficiency and reliability during disaster. Potentially being integrated with transit management software, like RouteMatch The web-based interface will offer real-time transit management service to authorized transit agencies. Objective: Providing transit agencies an implemental real-time transit vehicle operation management system in an emergency evacuation.
Incorporating Transportation Network Modeling Tools within Transportation Economic Impact Studies of Disasters Case Study: the Gulf Coast Region in Mississippi during Hurricane Katrina Objective:to propose a framework in which transportation network modeling tools are incorporated for estimating the direct and indirect economic impacts of a disaster on intermodal transportation systems Results Categories: Direct transportation economic impacts: restoration costs of damaged or destroyed transportation system infrastructures. Indirect transportation economic impacts: Highway Cost of rerouting delays, Cost of congestion delays, Cost of additional emissions and pavement maintenance Railroad Cost of rerouting delays Figure 3 Map of Railroad System of the Gulf Coast Region in the State of Mississippi Obtained from the MDOT website (http://www.gomdot.com/Divisions/IntermodalPlanning/Resources/Maps/pdf/Rails.pdf) Figure 2 Map of Highway System of the Gulf Coast Region in the State of Mississippi Obtained from the Mississippi Department of Transportation (MDOT) website (http://gomdot.com/Divisions/IntermodalPlanning/Resources/Maps/StateHighwayMaps.aspx)
Coordination of Connected Vehicle and Transit Signal Priority on Transit Evacuations Objective: Evaluate the impacts of the proposed TSP strategies on the transit-based emergency evacuation and provide an implementable and practical TSP system CORSIM Simulation • Scenario 1 – No TSP • Scenario 2 – Transit Signal Preemption • Scenario 3 – TSP Only • Scenario 4 – TSP + Connected Vehicle With Connected Vehicle, an adaptive transit signal priority system is able to optimize the effective timing plan based on real-time observed data.
Driver Speed Limit Compliance in School Zones: Assessing the Impact of Sign Saturation Objective: to evaluate the impact of school zone sign density on reducing driver speed in school zones. • Anticipated Benefits: • Assist decision makers when choosing where to locate school zones and school zone signs. • Aid decision makers to reduce the number of school zones across the state which would save money (fewer signs), and to improve the effectiveness of existing school zones. • Help decision makers to inform local municipalities about the need for additional enforcement of speed reduction in school zones based on empirical data. • A stepping stone to future work on studying the impact of other types of sign saturation (e.g. wildlife, work zones) on driver behavior.
Optimum Transit Operations During Emergency Evacuations Optimum Evacuation Plan Buses Gulfport CTA Fixed Routes Plan Shelters Pickup points
GPS REAL-TIME OPERATIONS SUPPORT FOR EMERGENCY EVACUATIONS System Architecture • Improve the operation of large-scale emergency vehicular evacuations • Create a system which emergency management agencies and/or other public safety organizations can rapidly deploy • Computer-to-computer or center-to-center data exchange • Provide a comprehensive family of communication protocols covering all appropriate ITS applications Robust Communication Deploy the sensors
MSU Starkville Campus Emergency Evacuation Traffic Assignment Evacuation Traffic Assignment (ETA) is a major component of Emergency Evacuation Plan (EEP) -- an indispensable preparedness package for disaster threatened areas • Objective: • 1. Generate ETA from each major parking lot to university exits • 2. Evaluate traffic management and ETA strategies in reducing clearance time • Approach: • Identify traffic management scenarios • Generate ETA and simulate in CORSIM using Path-Following algorithm • Generating ETA through iterations of manual adjustment so that all gate clearance times are approximately the same • Analyze sensitivity of key CORSIM parameters for ETA reasonableness
Studies on Impact of Aircraft Maintenance Labor and Parts Tax in the State of Mississippi Evaluate the impact of the 7% tax on maintenance labor and parts on the Mississippi aircraft maintenance industry, state economy and the State tax revenue.
Natchez Trace Parkway Traffic Safety Study Accident Locations Accident Causes Driver Causes Classification Natchez Trace Parkway is a recreational route that accommodates traffic from Mississippi, Alabama, and Tennessee. It is also the most direct route from Nashville, TN to Jackson, MS. Objectives: Gains From Detailed Analysis of the Available Accident Historical Data and Other Available Information. Crash Prediction by IHSDM Interactive Highway Safety Design Model (IHSDM) Traffic Safety Software Package is Used to Analyze the Safety and Operation Performance
NTPEP Pavement Marking Material Evaluation Mississippi State Deck- Your Tax $ at Work The forth time (1999, 2002, 2004, 2006) Mississippi State University civil engineering department hosts a three year Pavement Marking Material evaluation on behalf of AASHTO. • How the NTPEP Program Work? • MSU and Others Test Pavement Marking Product Performance Index: • Dry/ Wet Retro reflectivity • Durability • Day-time And Night-time Color • Database Uploaded to AASHTO • State DOT Choose Qualified Products from Database • Your Tax $ Would Purchase Quality Product!
Modeling Evacuation Traffic and Emergency Vehicle Operation in CORSIM A Case Study in Route 7, VA Discuss the new CORSIM Unique Feature: Emergency Vehicle and Driver Behavior Preliminary Conclusion • The EV driving behavior and the driver’s respond to emergency vehicles affects the EV travel time significantly. • Preemption saves EV approximately 10 seconds per signal. • Under evacuation traffic volume, EV travel time does not change much.
Study on Traffic Flow Operation in Work Zones Direction of Traffic 0.5 mile 0.5 mile L/2 1 mile L/2
MSU Starkville Campus Traffic Studies Traffic Data and Travel Surveys Parking Studies Campus Traffic Simulation Studies Evaluation of Bully Extension Plan Evaluation of 5 Phases Construction Plan Determining the Number of Lanes on Newly Constructed Road Impact of Parking Plan to Campus Construction and Traffic