Download
1 / 31
320 likes | 461 Views
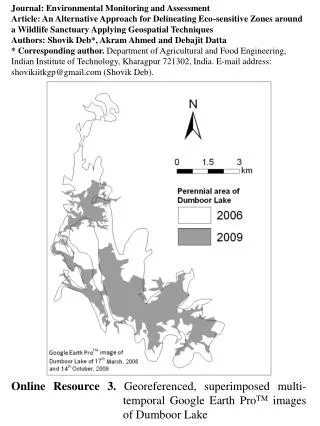
A. Argo as an Aid to Environmental Monitoring and Assessment: experience in the Gulf of Alaska. Howard Freeland and Steve MacDonald D.F.O. Science/Pacific Region, Canada Tel: (250)-363-6590 Email: FreelandHj@pac.dfo-mpo.gc.ca.

E N D
A Argo as an Aid to Environmental Monitoring and Assessment: experience in the Gulf of Alaska. Howard Freeland and Steve MacDonald D.F.O. Science/Pacific Region, Canada Tel: (250)-363-6590 Email: FreelandHj@pac.dfo-mpo.gc.ca
Argo as an Aid to Environmental Monitoring and Assessment: experience in the Gulf of Alaska. 974 Floats Howard Freeland and Steve MacDonald D.F.O. Science/Pacific Region, Canada Tel: (250)-363-6590 Email: FreelandHj@pac.dfo-mpo.gc.ca
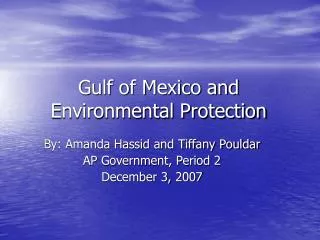
In 2002 an unusual climate anomaly appeared in the Gulf of Alaska
Line-P conditions as seen by Argo: a) Temperature anomaly. Actual Line-P Fake Line-P
Line-P conditions as seen by Argo: b) Salinity anomaly. Actual Line-P Fake Line-P
Some analysis has taken place. • Cold halocline in the northern California Current: an invasion of Subarctic water - Freeland, Gatien, Huyer and Smith. • ------------------------------------------ • Enhanced southward flow over the Oregon Shelf in 2002: a conduit for subarctic water - Michael Kosro. • Large-scale atmosphere-ocean anomalies during 2002 - Murphree, Bograd, Schwing and Ford • Altimeter estimates of anomalous transports into the northern California Current during 2000-2002 - Strub and James. • Anomalous satellite-measured chlorophyll concentrations in the northern California Current in 2001-2002 - Thomas, Strub and Brickley. • Cold halocline, increased nutrients, and higher chlorophyll off Oregon in 2002 - Wheeler, Huyer and Fleischbein. • Anomalous southward advection during 2002 in the northern California Current: Evidence from Lagrangian surface drifters - Barth • Anomalous subarctic influence in the southern California Current during 2002 - Bograd and Lynn.
Some analysis has taken place. • Anomalous subarctic influence in the southern California Current during 2002 - Bograd and Lynn. • The paper by Bograd and Lynn (2003) in particular suggests that there was an anomalous southward shift of the NPC bifurcation during 2002. Potentially such shifts could result in fluctuations in the California and Alaskan Currents that are 180° out-of-phase with each other [Chelton and Davis, 1982] and such shifts could easily have very significant impacts on ecosystems of the two current systems. • Can we observe this southward shift of the NPC bifurcation, Argo seems designed for this, and can we observe the anomalously strong southward transports?
How can we map the circulation of a basin using Argo data? The “obvious approach” would seem to be to compute dynamic heights at float profile locations, grid them, perhaps using an objective analysis routine and contour the grid. For example, Bretherton, Davis and Fandry in 1976. This does not make optimal use of the information available in basin-scale mapping, such as boundary conditions.
How can we map the circulation of a basin using Argo data and including boundary conditions? One solution was found in the 1993 thesis of Maryam Golnaraghi.
An alternative approach Thanks to assistance from Patrick Cummins and a quasi-geostrophic model of the Gulf of Alaska.
An alternative approach • Compute dynamic heights at every float location during the target month. • Compute mean value subtract from dynamic heights to produce a residual. • Fit EOF #1 to residuals, compute weight and subtract from observations to produce a new residual. • Fit EOF #2 to residuals, compute weight and subtract from observations to produce a new residual, etc for 20 EOFs. • Add mean and sum the EOFs multiplied by the computed weights. • Whatever remains is the residual error.
Sensitivity, Sept 2002 data…….. a) 20 modes + all data. b) 20 modes and restricted data subset. c) First 4 modes + all data. d) First 8 modes + all data.
Distribution of energy among eigenvectors For 12 monthly maps….. Fractional residual variance after adding EOF #N. Variance contributed by EOF #N.
Distribution of energy among eigenvectors For 12 monthly maps….. Fractional residual variance after adding EOF #N. Variance contributed by EOF #N. As above but for QG model.
A few circulation maps……. March May July 2002 2003 Many more maps are displayed at:- http://www.pac.dfo-mpo.gc.ca/sci/osap/projects/argo/Gak_e.htm
The transport in the California Current was indeed higher in spring/summer 2002.
Stratification at Ocean Station Papa Adapted from: Freeland, H.J. K.L. Denman, C.S. Wong, F. Whitney and R. Jacques. 1997. Evidence of change in the N.E. Pacific Ocean. Deep-Sea Res. 44(12), 2117-2129.
Stratification at Ocean Station Papa Adapted from: Freeland, H.J. K.L. Denman, C.S. Wong, F. Whitney and R. Jacques. 1997. Evidence of change in the N.E. Pacific Ocean. Deep-Sea Res. 44(12), 2117-2129.
What have been the effects on the Gulf of Alaska? Nutrient supply? Nitrate is never limiting at Station Papa so it would take a massive decrease in supply to have any impact. Frank Whitney reports that in 2003 the SiO3:NO3 ratio was dramatically different from normal suggesting a large decrease in the supply of silicate. This would lead to changes in community composition, reduction in diatoms (large phytoplankton) meaning less food available for the larger zooplankton that fish like to eat.
What have been the effects on the Gulf of Alaska? Fish? Steve McDonald reports that salmon returning to the fishery in 2003 have low fat content. This means that the fish arrive back to the fishery looking fine but do not necessarily reproduce successfully. Two reasons are possible: a) Low food supply. b) Increased metabolic requirements in the open ocean phase of migration. This could be caused by high temperatures. A paper in press by Crossin, Hinch, Farrell, Higgs and Healey explores somatic energy patterns in salmon at the end of the ocean residency period and cite both a) and b) as major impacts on prespawning and en route mortality.