Download
1 / 7
70 likes | 207 Views
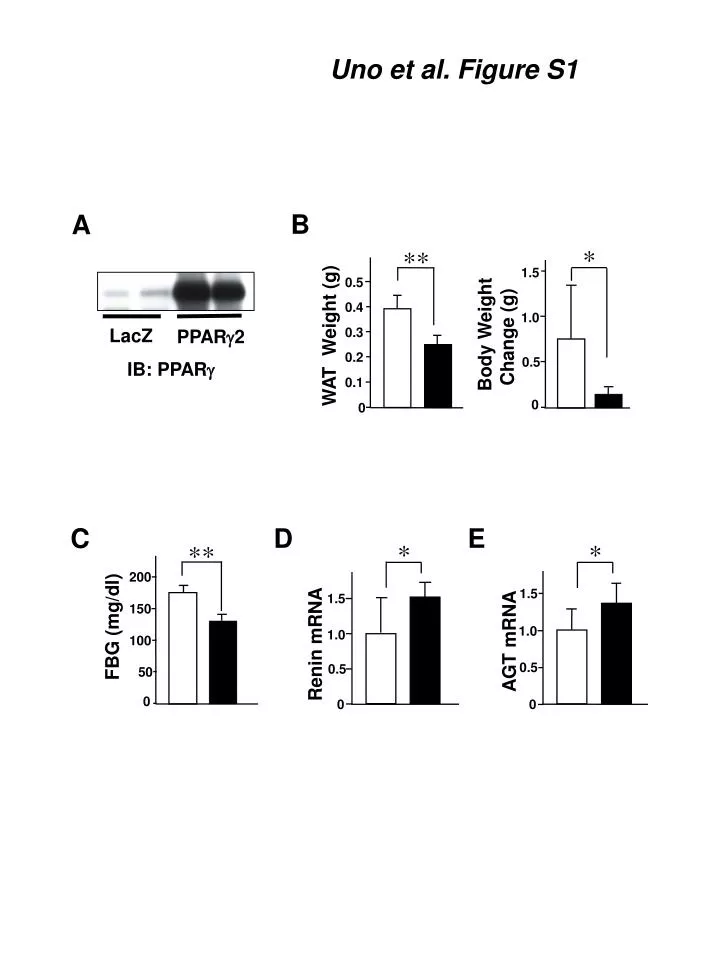
Uno et al. Figure S 1. B. A. *. **. 1.5. 0.5. 0.4. 1.0. Body Weight Change (g). WAT Weight (g). LacZ. PPAR g 2. 0.3. 0.2. IB: PPAR g. 0.5. 0.1. 0. 0. C. D. E. *. *. **. 200. 1.5. 1.5. FBG (mg/dl). 150. AGT mRNA. 1.0. Renin mRNA. 1.0. 100. 0.5. 0.5. 50.

E N D
Uno et al. Figure S1 B A * ** 1.5 0.5 0.4 1.0 Body Weight Change (g) WAT Weight (g) LacZ PPARg2 0.3 0.2 IB: PPARg 0.5 0.1 0 0 C D E * * ** 200 1.5 1.5 FBG (mg/dl) 150 AGT mRNA 1.0 Renin mRNA 1.0 100 0.5 0.5 50 0 0 0
Uno et al. Figure S2 N S N S 50 40 30 Body Weight (g) 20 10 0 KK KK-Ay
Uno et al. Figure S3 vehicle capsaicin S100 CGRP
Uno et al. Figure S4 vehicle capsaicin S100 CGRP
Uno et al. Figure S5 N S N S 0.4 0.3 0.3 WAT Weight (g) 0.2 0.2 0.1 0.1 0 0
Uno et al. Figure S6 C A B * ** ** 150 3 2 SREBP1c mRNA 100 FAS mRNA Fsp27 mRNA 2 1 50 1 0 0 0 PPARg2 LacZ D E ** * 0.4 2 0.3 UCP1 mRNA WAT weight (g) 0.2 1 0.1 0 0 F G ** * 200 1.5 150 FBG (mg/dl) Renin mRNA 1 100 0.5 50 0 0
Uno et al. Figure S7 * * ** ** 4 15 3 Fsp27 mRNA 10 2 5 1 0 KK KK-Ay 0 NC DIO