Download
1 / 17
170 likes | 350 Views
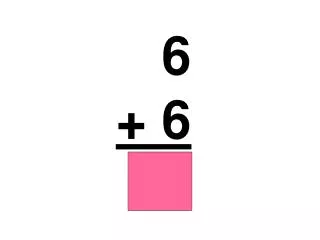
Nonlinear Functions. 12-6. Course 2. Warm Up. Problem of the Day. Lesson Presentation. Nonlinear Functions. 12-6. 1 7. ; –1. 2 3. – ; 5. Course 2. Warm Up Tell the slope and y- intercept of each line, given the equation. 1. y = –8 x + 7 2. y = x – 1 3. y = 9 x

E N D
Nonlinear Functions 12-6 Course 2 Warm Up Problem of the Day Lesson Presentation
Nonlinear Functions 12-6 1 7 ; –1 2 3 – ; 5 Course 2 Warm Up Tell the slope and y-intercept of each line, given the equation. 1.y = –8x + 7 2.y = x – 1 3.y = 9x 4.y = – x + 5 –8; 7 1 7 9; 0 2 3
Nonlinear Functions 12-6 Course 2 Problem of the Day Name a value of x for which y = 5x is less than y = x2, for which y = 5x equals y = x2, and for which y = 5x is greater than y = x2. any x less than 0 and greater than 5; x = 0 or 5; any x between 0 and 5
Nonlinear Functions 12-6 Course 2 Learn to identify nonlinear functions.
Nonlinear Functions 12-6 Course 2 Insert Lesson Title Here Vocabulary nonlinear function
Nonlinear Functions 12-6 Course 2 As you inflate a balloon, its volume increases. The table below shows the increase in volume of a round balloon as its radius changes. Do you think a graph of the data would or would not be a straight line? You can make a graph to find out. A nonlinear functionis a function whose graph is not a straight line.
Nonlinear Functions 12-6 Course 2 Additional Example 1A & 1B: Identifying Graphs of Nonlinear Functions Tell whether the graph is linear or nonlinear. B. A. The graph is not a straight line, so it is nonlinear. The graph is a straight line, so it is linear.
Nonlinear Functions 12-6 Course 2 Additional Example 1C & 1D: Identifying Graphs of Nonlinear Functions Tell whether the graph is linear or nonlinear. D. C. The graph is a straight line, so it is linear. The graph is not a straight line so, it is nonlinear.
Nonlinear Functions 12-6 4 x 4 –4 0 –4 Course 2 Try This: Example 1A & 1B Tell whether the graph is linear or nonlinear. y A. B. y 4 x 4 –4 0 –4 The graph is a straight line, so the graph is linear. The graph is not a straight line, so it is nonlinear.
Nonlinear Functions 12-6 Course 2 Try This: Example 1C & 1D Tell whether the graph is linear or nonlinear. y C. D. y 4 4 x x 4 4 –4 –4 0 0 –4 –4 The graph is a straight line, so the graph is linear. The graph is not a straight line, so it is nonlinear.
Nonlinear Functions 12-6 Course 2 You can use a function table to determine whether ordered pairs describe a linear or nonlinear relationship. For a function that has a linear relationship, when the difference between each successive input value is constant, the difference between each corresponding output value is constant. For a function that has a nonlinear relationship, when the difference between each successive input value is constant, the difference between each corresponding output value varies.
Nonlinear Functions 12-6 Course 2 Additional Example 2A: Identifying Nonlinear Relationships in Function Tables Tell whether the function in the table has a linear or nonlinear relationship. A. difference = 1 difference = 3 difference = 1 difference = 6 The difference between consecutive input values is constant. The difference between consecutive output values is not constant. The function represented in the table is nonlinear.
Nonlinear Functions 12-6 Course 2 Additional Example 2B: Identifying Nonlinear Relationships in Function Tables Tell whether the function in the table has a linear or nonlinear relationship. A. difference = 1 difference = 3 difference = 1 difference = 3 The difference between consecutive input values is constant. The difference between consecutive output values is constant. The function represented in the table is linear.
Nonlinear Functions 12-6 Course 2 Try This: Example 2A Tell whether the function in the table has a linear or nonlinear relationship. A. difference = 1 difference = 3 difference = 1 difference = 5 The difference between consecutive input values is constant. The difference between consecutive output values is not constant. The function represented in the table is nonlinear.
Nonlinear Functions 12-6 Course 2 Try This: Example 2B Tell whether the function in the table has a linear or nonlinear relationship. A. difference = 1 difference = 2 difference = 1 difference = 2 The difference between consecutive input values is constant. The difference between consecutive output values is constant. The function represented in the table is linear.
Nonlinear Functions 12-6 Course 2 Insert Lesson Title Here Lesson Quiz: Part 1 1. Tell whether the graph is linear or nonlinear. nonlinear
Nonlinear Functions 12-6 Course 2 Insert Lesson Title Here Lesson Quiz: Part 2 2. Tell whether the function in the table could be linear or is nonlinear. could be linear