Download
1 / 32
320 likes | 444 Views
Land, Building, and Field Use Committee. New Trier Township High School District #203. July 18, 2011. Part I Land Data. Site Acreage. Winnetka Campus: 26.4 Northfield Campus: 42.2 Duke Childs Field: 15.0 Fox Meadow: 9.7 District Owned Acreage: 93.3 Cook County Forest Preserve*: 5.0.

E N D
Land, Building, and Field Use Committee New Trier Township High School District #203 July 18, 2011
Site Acreage Winnetka Campus: 26.4 Northfield Campus: 42.2 Duke Childs Field: 15.0 Fox Meadow: 9.7 District Owned Acreage: 93.3 Cook County Forest Preserve*: 5.0 *This land cannot be purchased by state law. **Includes green space at both campuses that is utilized by the Kinetic Wellness and Athletic departments that is not within the competition field areas.
WINNETKA CAMPUS WINNETKA SOFTBALL DIAMOND NORTH 2 NORTH 3 NORTH 4 NORTH 1 TRACK FIELD ESSEX WINNETKA 2 TENNIS COURTS SCHOOL WINNETKA 1 WINNETKA
NORTHFIELD CAMPUS FOREST PRESERVE FIELD 3 FIELD 5 FIELD 2 FIELD 6 FIELD 4 TRACK FIELD FIELD 1 STADIUM
Parking Data Winnetka Campus Northfield Campus West Lot: 528South Lot: 113Southeast Lot: 58East Lot: 93 Total: 792 On Campus (Owned): 228 On Street (Leased): 222 Remote Lot (Leased): 199 Total: 649
Gross Square Footage Data Winnetka Campus Northfield Campus Cafeteria: 26,097 Boiler Plant: 17,456 Gates Gym: 126,268 Tech Arts: 37,107 North Building: 137,181 Music Building: 43,946 Tower Building: 243,306 Auditorium: 58,516 Bickert Gyms: 65,279 Total GSF: 755,156 Building A: 69,223 Building B: 59,587 Building C: 56,246 Building D: 68,400 Building E: 56,434 Building F: 112,138 Total GSF: 422,028
Standard ClassroomsSquare Foot Summary Winnetka Northfield 1 0 20 2 8 8 3 42 < 500 500 - 599 600 - 699 700 - 799 800 - 899 900 - 999 1000+ Total 2 13 44 5 2 3 3 72 46,781 SF 32,094 SF (14,686) SF
Support Facilities *Deficiencies exist in both the swimming pool and running track at the Northfield Campus and the indoor running track at the Winnetka Campus.
Support Facilities Summary *Deficiencies exist in both the swimming pool and running track at the Northfield Campus and the indoor running track at the Winnetka Campus.
Northfield Campus Comparison1981 vs. 2011 • Additional classrooms in 1981: • B Building – 18, C Building – 9, D Building – 1 • Average number of courses per student : • 1981: 5.4-5.8 (Approximately 1950 students taking 11000 classes) • 2011: 6.8 (1070 students taking 7263 classes) • Capacity Change • 35% fewer classrooms • 20% more classes per student • If capacity of 1981 configuration was 2900 students: • Reduced number of classrooms → capacity of 1885 • Increased number of classes/student → capacity of 1510* • *Note this analysis does not take into account a number of factors which include: specific programmatic constraints, class size differences, double period classes all of which would lower the capacity.
Northfield Campus Comparison1981 vs. 2011 • If capacity of 1981 school was 2900 students: • Reduced number of classrooms → capacity of 1885 • Increased number of classes/student → capacity of 1510* • *Note this analysis does not take into account a number of factors which include: specific programmatic constraints, class size differences, double period classes all of which would lower the capacity.
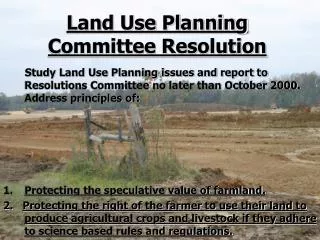
Conclusions • LAND • Total acreage small compared to other large high schools • We need all of the field space on and off both campuses • No land to purchase adjacent to either campus • Parking and Traffic difficulties at both campuses
Conclusions • BUILDINGS • The Winnetka Campus has almost twice the square footage as the Northfield Campus. • The Winnetka Campus has 67 more academic program spaces and 38 more support program spaces • Use of space has changed significantly in past 30 years • Enrollment capacities have changed since the 1960s and 1970s • Students take an average of at least one more class. • Spaces originally designed as classrooms are now used for programmatic needs such as Special Education, computer labs, and interdisciplinary courses. • Split schedules and mobile classrooms were needed during the maximum enrollment years.
Conclusions • FIELDS • Northfield has significantly more acreage, but most of the additional acreage is unusable for programmatic needs in Kinetic Wellness and Athletics. • Athletic field space is almost exactly the same on both campuses. • Every acre of outdoor field space is used to capacity in the Fall, Spring, and Summer. • Student-athletes travel to practice areas after school. • All-weather surfaces would dramatically increase capacity for field use.