Download
1 / 37
370 likes | 470 Views
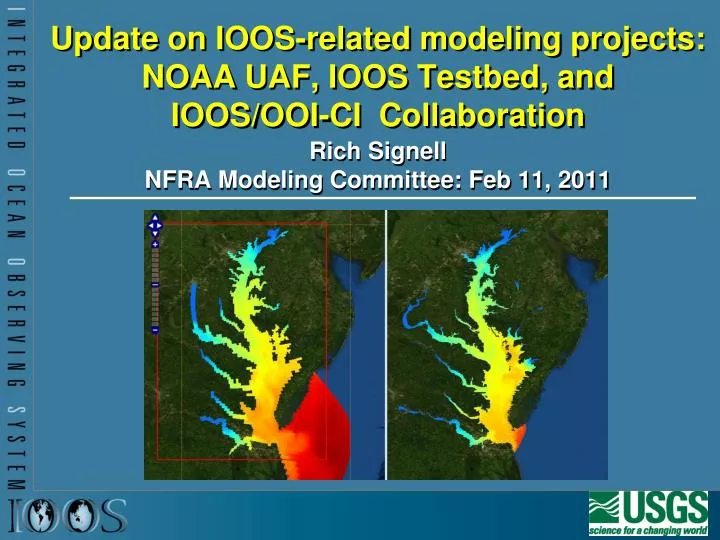
Update on IOOS- related modeling projects: NOAA UAF, IOOS Testbed, and IOOS/OOI-CI Collaboration. Rich Signell NFRA Modeling Committee: Feb 11, 2011. Geoinformatics.

E N D
Update on IOOS-related modeling projects: NOAA UAF, IOOS Testbed, and IOOS/OOI-CI Collaboration Rich SignellNFRA Modeling Committee: Feb 11, 2011
Geoinformatics “The art, science and technology dealing with the acquisition, storage, processing production, presentation and dissemination of geoinformation” - Manfred Ehlers, 1993
Geoinformatics Projects • NOAA Detail: Developing Model Data Interoperability for IOOS • IOOS Modeling Testbed: Defining skill metrics, evaluating model performance, developing cyberinfrastructure and facilitating transition from research to operations • OOI-CI/IOOS Collaboration project: improve data acceess for forecast modelers • NOAA Unified Access Framework Project: data integration across NOAA • USGS CDI Tech Stack Working Group • USGS Strategic Science Planning Team (Core Science) • Great Lakes Restoration Initiative Cyberinfrastructure development with USGS Center for Integrated Data and Analysis (CIDA)
US Integrated Ocean Observing System (IOOS®) • IOOS® Plan defines: • Global Component • Coastal Component • 17 Federal Agencies • 11 Regional Associations
Issue: Ocean grids are not regularly spaced! Curvilinear orthogonal horizontal coordinates Stretched surface and terrain following vertical coordinates
NJ Toolkit for Matlabhttp://njtbx.sourceforge.net • Objective: Make it simple to access CF data • Example function: • [t, geo]=nj_tslice(URL,’temp’,1); • t = 22x120x180 single • geo = • lat: [120x180 single] • lon: [120x180 single] • z: [22x120x180 double] • time: 733582 (matlabdatenum) • nj_tslice works identically for ROMS, POM, ECOM, WRF, Wavewatch3 • URI can be: local NetCDF, remote NetCDF, NcML, OpenDAP Data URL
Comparing Models with Data in Matlab Model 1: UMASS-ECOM Model 2: UMAINE-POM Data: SST 2008-Sep-08 07:32
Working with Data in ArcGIS using the NOAA/ASA Environmental Data Connector
Single Point of Access Catalog:GEO-IDE => IOOS Regions GEO-IDE Web Site: http://geo-ide.noaa.gov
14 Different Ocean Forecast Models Spanning CONUS Waters in IDV
Successes • Demonstrated interoperability with 17 THREDDS servers in all 11 IOOS Regions • Little or no effort on the data provider • What did we get? • Single point of access for regional model results • Interoperable software (less need for custom coding) • More usage of model results • More eyes on the model results • More feedback to modelers => Improved models • Increased community support for standards-based access • More efficient retrieval of data => more time to do science
A Super-Regional Modeling Testbed for Improving Forecasts of Environmental Processes for the U.S. Atlantic and Gulf of Mexico CoastsDon Wright, SURAPrincipal InvestigatorRich Signell, USGS Technical Advisory and Evaluation Group Chair
Motivation for the testbed: improving prediction of environmental processes • Design of this testbed • Year 1 products • Future work Outline
Improving Forecasts of Coastal Environmental Processes • Factors: open boundary conditions, surface and river forcing conditions, enhanced physics, adjustable parameters, data assimilation, numerics, amount of data assimilated, skill of modelers(!), vertical and horizontal resolution, coupling to wave and met models. • “Which model is better?” is not the right question. What factors in the simulation resulted in a better solution? How much better? At what cost?
Defining Improvement • To measure improvement for environmental processes, we need to define skill metrics for specific environmental processes and often for specific region • Inundation, search and rescue, deep oil spills, navigation, hypoxia, harmful algal blooms, diver operations, alternative energy siting, beach erosion, regional impact of climate change all require different skill metrics • Operational centers need community help in this process – too broad for NOAA and NAVY!
A Common Cyberinfrastructure for Model Data The ocean community needs a common cyberinfrastructure to access, analyze and display data from the different models: each model currently has their own standards and toolsets Unstructured Grid Structured Grids 10 nodes 5x5 6x3 Variety of Stretched Vertical Coordinates
Build a common infrastructure to enable access, analysis and visualization of all coastal ocean model data produced by NOAA, NAVY and IOOS • Develop skill metrics and assess models in three different regions and dynamical regimes, to ensure a robust and powerful infrastructure • Identify factors that could be transitioned to operations • Build stronger relationships between academia and operational centers through collaboration A Testbed Framework for Coastal Ocean Models
IOOS Testbed Team Structure 7 members 25 members Don Wright, SURA Rich Signell, USGS Doug Levin, NOAA/IOOS Liz Smith, SURA EoinHowlett, ASA 20 members 21 members 24 members John Harding, MSU Rick Luettich, UNC-CH Carl Friedrichs, VIMS
Mapping services and browse application • Cyberinfrastructure (CI)All Regions – All Teams • Extending CI from OGC, Unidata and others (NOAA DMIT, USGS CDI) to support unstructured grids, and add functionality • Web Access via OpenDAP w/CF • Unidata Common Data Model/NetCDF Java Library API • Distributed search capability • Browser based map viewer (WMS) • Toolbox for scientific desktop analysis • All components standards-based! Search services Analyze in scientific desktop application
Inundation Extra-tropical – Gulf of MaineTropical – Gulf of Mexico- 4 models: 3 unstructured grid +1 structured grid- Coupled wave-storm surge-inundation (TWL)- Consistent forcing, validation and skill assessment using existing IMEDS tool • Extensive observational data sets for historical storms Ike, Rita and Gustav in standard formats • SURA has provided supercomputer resources Extratropical Grid Tropical Grids for Galveston Bay
Estuarine Hypoxia Chesapeake Bay 1. Estuary: – 5 Hydrodynamic models – 3 Biological (DO) models – 2004 data from 28 CBP stations – Comparing T, S, max (dS/dz), DO via target diagrams 2. Shelf: OBCs 5 hydrodynamic models Dissolved Oxygen Stratification (dS/Dz) Models doing better on oxygen than stratification!
Shelf Hypoxia Gulf of MexicoHydrodynamic & biogeochemical hindcastcomparisons of hypoxia model (stand alone) coupled to 3 different Gulf of Mexico hydrodynamics models Evaluation of two shelf hypoxia formulations (NOAA & EPA)
Testbed Year 1 Products • Foundation of a cyberinfrastructure framework for search, access and display of all NOAA, NAVY and IOOS model data, via browser and scientific desktop application • Skill metrics and identification of key performance factors and cost for three important dynamical regimes and environmental issues • CONOPS for transition from research to operations • Improved communication between research and operations
Future Work for the Testbed • Expand to more regions and problems • Examine more factors (e.g. data assimilation) • Build out the cyberinfrastructure • Conduct training in the community • Sustaining future development
NSF Ocean Observatories Initiative Ocean Observatories Initiative
Architectural Overview – Client View 2010/2011 OOI-CI – IOOS Collaboration Other models ROMS 4DVAR Ocean Forecast Models (Rutgers & UHawaii) OOI-CI OOI-CI Service Translation Format Conversion Notification Feeds/ Subscriptions Service Translation Format Conversion Notification Feeds/ Subscriptions External Observatory Integration (EOI) External Observatory Integration (EOI) External Observatory Integration (EOI) IOOS Catalog IOOS Catalog SOS TDS SOS SOS WaterML HTTP USGS AOML NDBC Wx NDBC HFR CO-OPS WL IOOS RAs Non-IOOS Sources IOOS Data Sources 33
The Fourth Paradigm: eScience • Thousand years ago: science was empirical describing natural phenomena • Last few hundred years: + theoretical branch using models, generalizations • Last few decades: + computational branch simulating complex phenomena • Today: + data exploration branch (eScience) • Data captured by instruments or simulations • Processed by software • Information/knowledge stored in computer • Scientist analyzes database / files using data management and statistics Ref: Slide from Turing Award Winner Jim Gray’s presentation to the NRC, Jan 11, 2007 (last presentation - lost at sea Jan 28)
Real benefits of Geoinformatics • More usage of model results for science • More feedback to modelers => Improved models • More efficient retrieval of data => More time to do science
Opportunities for IOOS modelers (1/2) • Join the IOOS Model Data Interoperability Google Group: http://groups.google.com/group/ioos_model_data_interop • Join the Unstructured Grid Interoperability Google Group: http://groups.google.com/group/ugrid-interoperability • Try out the MatlabnjToolbox to access CF-compliant model output: • http://njtbx.sourceforge.net
Opportunities for IOOS modelers (2/2) • Let me know if there are models that need to be added to the NOAA Geo-IDE IOOS list athttp://geo-ide.noaa.gov • Let me know if there are additional data streams we should handle for the OOI-CI/IOOS project (rsignell@usgs.gov)