Download
1 / 1
10 likes | 152 Views
Interannual Variability of subsurface connection in Southeastern Tropical Pacific during 1999 – 2004. Ivonne Montes 1,a , C. Böning 2,b , F. Colas 3,c , W. Schneider 1,d and B. Blanke 4,e. EUC. SEC.

E N D
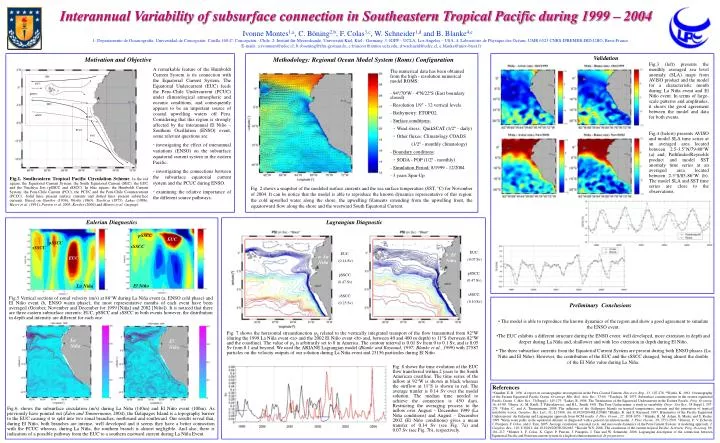
Interannual Variability of subsurface connection in Southeastern Tropical Pacific during 1999 – 2004 Ivonne Montes1,a, C. Böning2,b, F. Colas3,c, W. Schneider1,d and B. Blanke4,e EUC SEC 1: Departamento de Oceanografía. Universidad de Concepción. Casilla 160-C. Concepción - Chile. 2: Institut für Meereskunde, Universität Kiel, Kiel - Germany. 3: IGPP – UCLA, Los Angeles – USA. 4: Laboratoire de Physique des Océans, UMR 6523 CNRS-IFREMER-IRD-UBO, Brest-France. E-mails: a:ivonnem@udec.cl, b:cboening@ifm-geomar.de, c:francois@atmos.ucla.edu, d:wschneid@udec.cl, e:blanke@univ-brest.fr pSSCC EUC SEC Motivation and Objective sSSCC PCUC Validation • A remarkable feature of the Humboldt Current System is its connection with the Equatorial Current System. The Equatorial Undercurrent (EUC) feeds the Peru–Chile Undercurrent (PCUC) under climatological atmospheric and oceanic conditions, and consequently appears to be an important source of coastal upwelling waters off Peru. Considering that this region is strongly affected by the interannual El Niño – Southern Oscillation (ENSO) event, some relevant questions are: • investigating the effect of interannual variations (ENSO) on the subsurface equatorial current system in the eastern Pacific. • investigating the connections between the subsurface equatorial current system and the PCUC during ENSO. • examining the relative importance of the different source pathways. Methodology: Regional Ocean Model System (Roms) Configuration PCCC Fig.3 (left) presents the monthly averaged sea level anomaly (SLA) maps from AVISO product and the model for a characteristic month during La Niña event and El Niño event. In terms of large-scale patterns and amplitudes, it shows the good agreement between the model and data for both events. Fig.4 (below) presents AVISO and model SLA time series at an averaged area located between 2.5-3.5°N/79-80°W (a) and, Pathfinder/Reynolds product and model SST anomaly time series at an averaged area located between 2-3°S/85-86°W (b). The model SLA and SST time series are close to the observations. PCC The numerical data has been obtained from the high - resolution numerical model ROMS: - 94º/70ºW - 4ºN/22ºS (East boundary closed) • Resolution 1/9° - 32 vertical levels. - Bathymetry: ETOPO2. - Surface conditions: • Wind stress: QuikSCAT (1/2º – daily) • Other fluxes: Climatology COADS (1/2º - monthly climatology) • Boundary conditions: • SODA - POP (1/2º - monthly) • Simulation Period:8/1999 - 12/2004 • 3 years Spin-Up • Fig.1.Southeastern Tropical Pacific Circulation Scheme.In the red square, the Equatorial Current System: the South Equatorial Current (SEC), the EUC and the Tsuchiya Jets (pSSCC and sSSCC). In blue square, the Humboldt Current System: the Peru-Chile Current (PCC), the PCUC and the Peru-Chile Countercurrent (PCCC). Solid lines present surface currents and dotted lines present subsurface currents. Based on Gunther (1936), Wyrtki (1963), Tsuchiya (1975), Lukas (1986), Huyer et al. (1991), Penven et al. 2005, Kessler (2006) and Montes et al. (in prep). Fig. 2 shows a snapshot of the modeled surface currents and the sea surface temperature (SST, °C) for November of 2004. It can be notice that the model is able to reproduce the known dynamics representative of this region: the cold upwelled water along the shore, the upwelling filaments extending from the upwelling front, the equatorward flow along the shore and the westward South Equatorial Current. Eulerian Diagnostics Lagrangian Diagnostic pSSCC pSSCC EUC sSSCC EUC: (0.07 Sv) pSSCC: (0.47 Sv) sSSCC: (0.10 Sv) sSSCC EUC: (0.14 Sv) pSSCC: (0.47 Sv) sSSCC: (0.25 Sv) b. El Niño a. La Niña EUC La Niña El Niño Fig.5 Vertical sections of zonal velocity (m/s) at 88°W during La Niña event (a, ENSO cold phase) and El Niño event (b, ENSO warm phase); the most representative months of each event have been averaged (October, November and December for 1999 [Niña] and 2002 [Niño]). It is noticed that there are three eastern subsurface currents: EUC, pSSCC and sSSCC in both events however, the distribution in depth and intensity are different for each one. Preliminary Conclusions • The model is able to reproduce the known dynamics of the region and show a good agreement to simulate the ENSO event. • The EUC exhibits a different structure during the ENSO event: well developed, more extension in depth and deeper during La Niña and, shallower and with less extension in depth during El Niño. • The three subsurface currents from the Equatorial Current System are present during both ENSO phases (La Niña and El Niño). However, the contribution of the EUC and the sSSCC changed, being almost the double of the El Niño value during La Niña. Fig. 7 shows the horizontal streamfunction ψh related to the vertically integrated transport of the flow transmitted from 92°W (during the 1999 La Niña event <a> and the 2002 El Niño event <b> and, between 40 and 400 m depth) to 11°S (between 82°W and the coastline). The value of ψh is arbitrarily set to 0 in America. The contour interval is 0.01 Sv from 0 to 0.1 Sv, and is 0.05 Sv from 0.1 and beyond. We used the ARIANE Lagrangian model (Blanke and Raynaud, 1997; Blanke et al., 1999) with 27587 particles on the velocity outputs of our solution during La Niña event and 23156 particules during El Niño. La Niña El Niño Fig. 8 shows the time evolution of the EUC flow transferred within 2 years to the South American coastline. The time series of the inflow at 92°W is shown in black whereas the outflow at 11°S is shown in red. The average tranfer is 0.14Sv over the model solution. The median time needed to achieve the connection is 450 days. Restricting the averaging process to the inflow over August – December 1999 (La Niña conditions) and August – December 2002 (El Niño conditions) gives a mean transfer of 0.14 Sv (see Fig. 7a) and 0.07 Sv (see Fig. 7b), respectively. Fig.6. shows the subsurface circulation (m/s) during La Niña (140m) and El Niño event (100m). As previously have pointed out (Eden and Timmermann, 2004), the Galapagos Island is a topography barrier to the EUC causing it to split into two zonal branches, northward and southward. Our results reveal that, during El Niño, both branches are intense, well developed and it seems they have a better connection with the PCUC whereas, during La Niña, the southern branch is almost negligible. And also, there is indication of a possible pathway from the EUC to a southern eastward current during La Niña Event. EUC References *Gunther, E. R. 1936. A report on oceanographic investigations in the Peru Coastal Current. Discovery Rep., 13, 107-276. *Wyrtki, K. 1963. Oceanography of the Eastern Equatorial Pacific Ocean. Oceanogr. Mar. Biol. Ann. Rev., 33-68. *Tsuchiya, M. 1975. Subsurface countercurrents in the eastern equatorial Pacific Ocean. J. Mar. Res., 33(Suppl.), 145-175. *Lukas, R. 1986. The Termination of the Equatorial Undercurrent in the Eastern Pacific. Prog. Oceanog. 16, 63-90. *Huyer, A., M. Knoll, T. Paluszkiewicz, and R.L. Smith. 1991. The Peru Undercurrent: a study in variability. Deep - Sea Res., 38 Suppl.1, 247-279. *Eden, C., and A. Timmermann. 2004. The influence of the Galápagos Islands on tropical temperatures, currents and the generation of tropical instability waves, Geophys. Res. Lett., 31, L15308, doi:10.1029/2004GL020060.*Blanke, B. and S. Raynaud. 1997. Kinematics of the Pacific Equatorial Undercurrent: An Eularian and Lagrangian approach from GCM results. J. Phys. Ocean., 27, 1038-1053. * Blanke, B., M. Arhan, G. Madec and S. Roche. 1999. Warm water paths in the equatorial Atlantic as diagnosed with a general circulation model. J. Phys. Ocean., 29, 2753-2768. *Penven, P., V. Echevin, J. Pasapera, F. Colas, and J. Tam. 2005. Average circulation, seasonal cycle, and mesoscale dynamics of the Peru Current System: A modeling approach, J. Geophys. Res., 110, C10021, doi:10.1029/2005JC002945. *Kessler W.S. 2006. The circulation of the eastern tropical Pacific: A review. Prog. Oceanog, 69, 181–217. *Montes I., F. Colas, X. Capet, P. Penven, J. Pasapera, J. Tam and W. Schneider. 2008. Lagrangian description of the connection between Equatorial Pacific and Peruvian current system in a high-resolution numerical, In preparation.