Download
1 / 46
460 likes | 483 Views
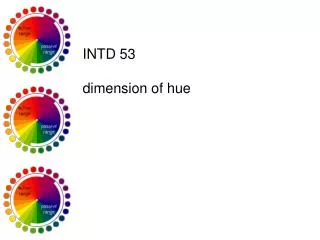
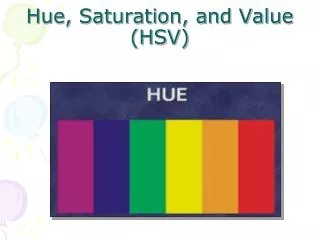
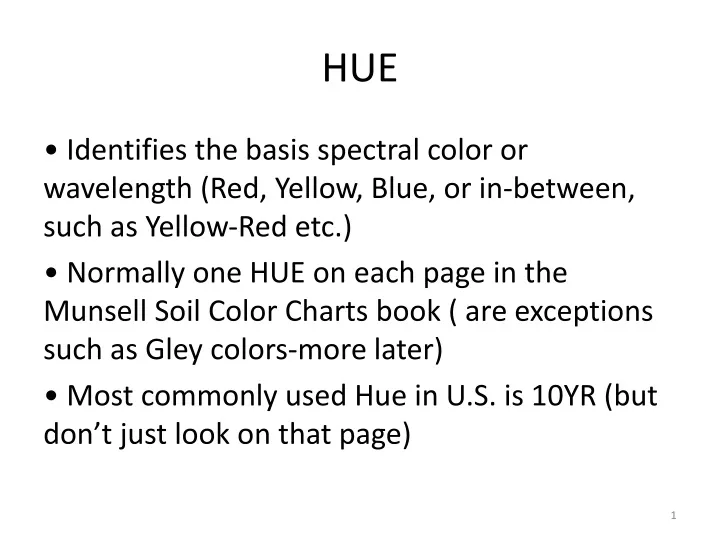
HUE. • Identifies the basis spectral color or wavelength (Red, Yellow, Blue, or in‐between, such as Yellow‐Red etc.) • Normally one HUE on each page in the Munsell Soil Color Charts book ( are exceptions such as Gley colors‐more later)

E N D
HUE • Identifies the basis spectral color or wavelength (Red, Yellow, Blue, or in‐between, such as Yellow‐Red etc.) • Normally one HUE on each page in the Munsell Soil Color Charts book ( are exceptions such as Gley colors‐more later) • Most commonly used Hue in U.S. is 10YR (but don’t just look on that page)
HUE Symbols(letter abbreviations) • R = Red; YR = Yellow‐Red; Y = Yellow • The letter is preceded by numbers 0 to 10 • Within each letter range the Hue becomes more yellow and less red as the numbers increase. For example: – 2.5YR is more red than 5YR – 7.5YR is less yellow than 10YR • Gley Charts include Neutral, Yellow, Green, Blue, Purple, and combinations.
HUE Symbols • The middle of the letter range is at 5 and the 0 point is the same as the 10 point of the next redder Hue. • Therefore, 5YR is in the middle of the yellow‐red Hue, which extends from 10R (0YR) to 10YR (0Y). • Pages in Munsell Book are prearranged from most red through most yellow.
VALUE • Indicates the degree of lightness or darkness, or reflectance of an object viewed in daylight • Scale is from 0 for the ideal black to 10 for the ideal white, in steps (units) that are visually equal. • Lightness increases from black at the bottom of page, through the grays, to nearly white at the top of the page.
CHROMA • The color intensity, saturation or relative strength of color. Indicates the degree of departure from a gray of the same Value. • The scale is from 0 ‐ 8 on the Munsell Color Chart. 0 indicates no strength (no color; gray) and 8 greatest strength (most color). Numbers are units of Chroma. • Read from left (lowest) to right (highest).
Low Chroma means: CHROMA 2 OR LESS • All hues have chroma 2 or less on the pages, therefore all hues have low chroma colors. • All Gley chart colors are comprised completely of low chroma colors. • Specific low chroma colors have meaning regarding the SHWT determination (more on this later).
Colors BETWEEN Chroma Chips • Colors exist between Chroma chips • They are noted differently than others • If the chroma is between two chips, note the lower one and add a “+” as a notation. • Example: The soil has more color than 10YR 6/1 and not enough to be 10YR 6/2. • The proper notation would be 10YR 6/1+ • DO NOT ROUND UP TO THE NEXT HIGHER CHROMA.
Reading soil colors • Optimum conditions –Natural light –Clear, sunny day –Midday –Light at right angles –Soil is moist (not wet or dry) A moist sample will not get any darker when water is added to the sample, and it will not glisten. A sample that is too wet will glisten in the sunlight, or the water puddles on the sample. When texturing, the soil should be easily manipulated by your thumb and forefinger. In non‐sandy soils, this could be compared to moist putty.
GLEY CHARTS • Two supplemental charts containing grayish, bluish and greenish colors often found in very wet mineral soils are contained on these charts. The charts also contain a Neutral Hue (no chroma). Soils with specific colors on these charts are very wet and will be discussed in a separate presentation.
What about the CHROMA for the Gley Charts? • Read chroma from the English name (left side) of the charts. Chroma designation will be to the right of the forward slash. Read Chroma from right of forward slash Note that all hues on the Gley Charts are chroma 1, except for two hues: • N (Neutral) having 0 (no) chroma (this is due to lack of iron giving any color), and • 5G _/2.
Is texturing or coloring performed first? • Coloring‐Redoximorphic features could be overlooked due to the physical manipulation of the soil if it was textured first. • All colors in the sample are recorded before texturing. Multiple colors easily blend. • The same soil sample should be used to both color and texture, increasing the accuracy of the profile.
Where is the best place to get the soil sample? • The sample to be colored (and textured) should come from an area that has not been disturbed or contaminated from the process of taking the sample (e.g. turning of the soil auger). • The sample must be obtained from the area of least disturbance, normally the middle of the sample. • The soil sample should be broken longitudinally to observe the colors and to collect the sample for texturing.
EXAMPLE IN AUGER BUCKET INSIDE THE AUGER BUCKET
COMPONENTS OF THE SOIL There are 4 basic components of soil. • Minerals (particle size) • Organic Matter • Water • Gases
SAND facts • Size is 2.0 mm to 0.05 mm in diameter • Individual particles visible without magnification • Gritty when Rubbed • Barely holds together when moist • Water Movement is Rapid to Very Rapid (large pores) Sand is the only particle size that is subdivided into smaller categories for texturing purposes.
• Very Coarse Sand: 2.00 ‐ 1.00 mm; thickness of nickel to just under a dime • Coarse Sand: 1.00 –0.50 mm; about 4 sheets of standard paper thickness (smallest) • Medium Sand (“Sand”): 0.50 –0.25 mm; sugar grain size • Fine Sand: 0.25 –0.10 mm pen point or strand of hair, thickness of business card • Very Fine Sand: 0.10 –0.05 mm use magnifying glass to see
SILT facts • Intermediate in diameter between sand and clay • Size is 0.05 mm to 0.002 mm in diameter • Difficult to see without magnification • When moist or dry, feels smooth and floury; silky • Primarily found on floodplains of rivers and areas in the southern part of Florida –(rare in Florida, but more abundant in SW Florida)
CLAY facts • Smallest mineral particle • Size is <0.002 mm in diameter • Individual particles can only be seen with a strong microscope • Water moves slowly through clay (small pores) • Sticky when moist –molds easily into shapes • Rare to find pure clay (common to find pure sand)
If we have sand, silt and clay size particles, what is LOAM? • Is not a soil particle size. • Is a soil texture composed of specific percentages of sand, silt and clay. • When texturing, a loam feels like equal parts of sand, silt and clay (feels somewhat gritty, yet fairly smooth and slightly plastic. When moist, it forms a cast that may be handled quite freely without breaking ). It does not have equal parts of each separate, but can be thought of as all the separates having approximately equal activity.
Sandy Soils • DO NOTFORM RIBBONS!!!!(Loamy Very Fine Sand will act more like silt and be somewhat gritty and malleable, but won’t ribbon.) • All loamy and clayey soils form ribbons with length being the deciding factor to determine texture. • Loams form shorter ribbons • Clays form longer ones. Loamy and Clayey Soils
What about texturing Silt??? • Silt lacks grittiness and feels extremely floury or silky when moist or dry. It will not ribbon and forms a weak ball that bears careful handling without breaking. Is malleable (able to be shaped/formed). Organic Matter (OM) and Texturing • Mineral Texture does not include OM • Must remove OM from consideration of mineral portion • If enough OM in sample, the texture of mineral material would be modified
NON‐SOIL PARTICLES (Coarse Fragments) • Particles >2 mm are not soil particles (i.e. the fine-earth fraction), they are Coarse Fragments and have several names. They do figure into the overall texture of a soil by modifying the mineral soil texture. • When the particle size exceeds 2mm, it moves out of the very coarse sand texture and is no longer a soil particle. These items can include shells, rocks, or other non‐soil (non‐fine earth) items. The modifier gravelly or "GR" is used when the fragment content by volume is ≥15% to <35%. Gravels range in size up to 75mm (3 inches).
Mineral Texture • Remove gravels from consideration as they are >2 mm in size and do not count as part of the mineral soil texture. • The gravel portion will modify the mineral texture name only if it occupied at least 15%of the volume of the soil horizon. • Example: Gravelly Loamy Fine Sand indicates that ≥15% and <35% gravels occupies the volume of the soil horizon whose soil texture was a Loamy Fine Sand.
Organic Matter (OM) • The second solid component of soils and consists primarily of pieces and parts of plants that are in various states of decay. Sometimes called humus. • Kinds of Organic Material (Most to Least decomposed)‐ Muck (Sapric); Mucky Peat (Hemic);Peat (Fibric)
Take your sunglasses off! • First, eliminate smearing of the profile from auger or shovel. If you have a soil pit take a clean slice from an uncompact side of the pit with the sharpshooter. If sharpshooter smears profile, use a putty knife to “clean up” profile to expose clear layer boundaries. If you are using auger, carefully break open your soil to get clean, non-smeared profile. • Place marker (e.g., golf tee) at bottom of each layer. Number layer in order from the top of the profile (see figure at left). • Take a photo of the profile. • Measure depth from the top of the soil profile to the bottom of each layer in centimeters (a metric fiberglass seamstress tape works well). Record the depth to the lower boundary of each layer. Note: This may be an iterative process as sometimes visual clues may be difficult to differentiate . As you examine the soil texture, you may have to adjust the placement of soil layer markers but always start by separating layers based on differences in color and other visual cues.
Take off your sunglasses! • For each layer, record the Soil Matrix Color using the Munsell Soil Chart. Soil Matrix Color is recorded as the Hue/Value/Chroma that matches most closely to the chips of the Munsell Soil Color Chart. • If soils are dry, wet the sample until moist (not saturated), and until sample no longer changes color. • Soil samples may start to dry quickly when exposed to air, re-wet the sample as needed. • Always have the sun at your back so that the soil sample is well lit when comparing the soil to the color chart to find the best match. Photo courtesy of Vermont Department of Environmental Conservation
Hydric Soil Indicators • For each Layer, record the Hue/Value/Chroma of Redox Concentrations. Redox concentrations are the result of iron oxidation as groundwater levels fluctuate throughout the growing season. These concentrations are orange/reddish-brown (due to iron) or dark reddish brown/black (due to manganese). Redox concentrations can occur as: • Nodules or concretions: firm irregularly shaped bodies with diffuse boundaries • Masses: other bodies occurring throughout the matrix (also known as mottles) • Pore linings: redox concentrations along root channels as a result of oxygen diffusion from the roots of plants into the surrounding soil matrix reacting with iron in the soil (also known as oxidized rhizospheres) • Record Redox Concentration Abundance (%): Estimate the percentage of redox concentration in each soil layer (see Plate 3). • For each Layer, record the Hue/Value/Chroma of Redox Depletions. Redox depletions occur when soils are flooded and iron and manganese are reduced to their soluble forms. These soluble forms of iron and manganese can be leached out of the soil, leaving the natural color (gray or black) of the parent sand, silt, or clay (i.e., the matrix) behind. • Record Redox Depletion Abundance (%): Estimate the percentage of redox depletions in each soil layer (see Plate 3). Photos and Figures courtesy of NRCS
Step 1. • Determine whether the horizon/layer is an organic or mineral soil • For each layer, take a dime-sized chunk of moist soil in your hand and gently rub the wet soil between forefinger and thumb 10 times. • If the soil feels greasy and leaves a light to dark stain on your hand, then the soil is either mucky mineral or organic soil (Go to Step 2.) • If soil does not feel greasy, the soil is a mineral soil (Go to Step 4.) Mineral Soil Organic Soil Photos accessed at http://soils.usda.gov/technical/classification/orders/images/ultisol.jpg and http://soils.usda.gov/technical/classification/orders/images/histosol.jpg
Step 2. • Texturing Soils with High Organic Matter Content- Distinguishing between mucky mineral and organic layers • For each organic soil layer, distinguish between mucky mineral or organic. Squeeze a chunk of wet soil and determine which of the following best describes the layer: • Organic – The soil has an organic texture if, when squeezed, it either extrudes liquid or much of the soil material does not stick to your hand. Identifiable plant parts are common (Go to Step 3). • Mucky Mineral (modifier) – The soil has a mucky mineral modifier if it is gritty or sticks to your hand when squeezed and rubbed. Identifiable plant fibers are rare to none (Go to step 4 and determine soil texture. It will be more difficult to determine soil texture of mucky mineral soils than mineral soils but do your best).
Step 3. • Distinguishing among organic matter decomposition stages for organic soil layers • Organic textures include Peat, Mucky-Peat, or Muck. The three textures are based on differences in percent volume of plant fibers visible with a hand lens after rubbing between thumb and forefinger 10 times. • To distinguish between the organic soils, take a fresh dime-sized chunk of moist soil. Rub that sample between your thumb and forefinger 10 times, and then visually estimate the percent volume of plant fibers and dead roots. Use the chart below to determine the organic matter decomposition state of the organic soil layer. Table modified from United States Department of Agriculture, Natural Resources Conservation Service. 2010. Field Indicators of Hydric Soils in the United States, Version 7.0. L.M. Vasilas, G.W. Hurt, and C.V. Noble (eds.). USDA, NRCS, in cooperation with the National Technical Committee for Hydric Soils.
Step 4: • Determine the texture of the mineral soil • For each mineral soil layer, use the soil texture flow chart (on page 9) to determine the texture of the mineral soil. • NOTE: Soil Texture encompasses only the fine earth fraction that is 2 mm (i.e., clay, silt or sand), not rock, gravel or organics (see figure to left for particle size scale). • If the soil layer is extremely rocky, or gravelly go to Step 5 on page 11 to determine if a coarse fragment texture modifier is appropriate for the soil layer. • If, after you have determined soil texture using the soil texture chart, you are still unsure of your soil texture results, check your results against the general descriptions of soil texture (page 10). Scale of Particle Size Image from Jones & Jones (2003). Accessed at http://www-personal.umich.edu/~jmpares/Sedimentary.htm
Image accessed at http://soils.usda.gov/education/resources/lessons/texture/soil_texture_low.jpg Soil Texture Flow Chart
Table taken from United States Department of Labor. Accessed at http://www.osha.gov/doc/outreachtraining/htmlfiles/soiltex.html
Step 5: • Determine if a coarse fragment texture modifier is appropriate for soils with large volume of coarse fragments • When a soil has more than 15% coarse fragments (particles >2.0 mm), the soil texture needs a coarse fragment modifier. • Go to table A. (below) and determine the appropriate coarse fragment texture modifier adjective (e.g., “very” or “extremely”). • Use that modifier with the appropriate coarse fragment type (See table B. for definitions of coarse fragment type by size class). • Combine the adjective from table A. with the fragment type from table B. for the coarse fragment texture modifier which you will attach to the soil texture for a given layer (see table C for examples). B. Coarse Fragment Size Class C. Examples of how to use Coarse Fragment Modifiers A. Modifier Usage (see Plate 3 on page 4 for surface area estimation) Tables modified from United States Department of Agriculture, Natural Resources Conservation Service. 2010. Field Indicators of Hydric Soils in the United States, Version 7.0. L.M. Vasilas, G.W. Hurt, and C.V. Noble (eds.). USDA, NRCS, in cooperation with the National Technical Committee for Hydric Soils.
Glossary Depleted matrix. For loamy and clayey material , a depleted matrix refers to the volume of a soil horizon or subhorizon in which the processes of reduction and translocation have removed or transformed iron, creating colors of low chroma and high value . A, E, and calcic horizons may have low chromas and high values and may therefore be mistaken for a depleted matrix; however, they are excluded from the concept of depleted matrix unless the soil has common or many distinct or prominent redox concentrations occurring as soft masses or pore linings. In some areas the depleted matrix may change color upon exposure to air (see Reduced matrix); this phenomenon is included in the concept of depleted matrix. Fibric. See Peat. Gleyed matrix. Soils with a gleyed matrix have the following combinations of hue, value, and chroma (the soils are not glauconitic): 1. 10Y, 5GY, 10GY, 10G, 5BG, 10BG, 5B, 10B,or 5PB with value of 4 or more and chroma of 1; or 2. 5G with value of 4 or more and chroma of 1 or 2; or 3. N with value of 4 or more; or In some places the gleyed matrix may change color upon exposure to air. (See Reduced matrix). This phenomenon is included in the concept of gleyed matrix . *Hemic. See Mucky peat Horizon. A layer, approximately parallel to the surface of the soil, distinguishable from adjacent layers by a distinctive set of properties produced by soil-forming processes. Layer(s). A horizon, subhorizon, or combination of contiguous horizons or subhorizons sharing at least one property referred to in the indicators Matrix. The dominant soil volume that is continuous in appearance and envelops microsites. When three colors occur, such as when a matrix, depletions, and concentrations are present, the matrix may represent less than 50 percent of the total soil volume. *Muck. Sapric organic soil material in which virtually all of the organic material is so decomposed that identification of plant forms is not possible. Bulk density is normally 0.2 or more. Muck has less than one-sixth fibers after rubbing, and its sodium pyrophosphate solution extract color has lower value and chroma than 5/1, 6/2, and 7/3. *Mucky modified mineral soil material. A USDA soil texture modifier, e.g., mucky sand. Mucky modified mineral soil material that has 0 percent clay has between 5 and 12 percent organic carbon. Mucky modified mineral soil material that has 60 percent clay has between 12 and 18 percent organic carbon. Soils with an intermediate amount of clay have intermediate amounts of organic carbon. Where the organic component is peat (fibric material) *Mucky peat. Hemic organic material, which is characterized by decomposition that is intermediate between that of fibric material and that of sapric material. Bulk density is normally between 0.1 and 0.2 g/cm3. Mucky peat does not meet the fiber content (after rubbing) or sodium pyrophosphate solution extract color requirements for either fibric or sapric soil material. Organic matter. Plant and animal residue in the soil in various stages of decomposition. Organic soil material. Soil material that is saturated with water for long periods or artificially drained and, excluding live roots, has 18 percent or more organic carbon with 60 percent or more clay or 12 percent or more organic carbon with 0 percent clay. Soils with an intermediate amount of clay have an intermediate amount of organic carbon. If the soil is never saturated for more than a few days, it contains 20 percent or more organic carbon. Organic soil material includes muck, mucky peat, and peat. *Peat. Fibric organic soil material. The plant forms can be identified in virtually all of the organic material. Bulk density is normally <0.1. Peat has three-fourths or more fibers after rubbing, or it has two-fifths or more fibers after rubbing and has sodium pyrophosphate solution extract color of 7/1, 7/2, 8/2, or 8/3. Redox concentrations. Bodies of apparent accumulation of Fe-Mn oxides . Redox concentrations include soft masses, pore linings, nodules, and concretions. For the purposes of the indicators, nodules and concretions are excluded from the concept of redox concentrations unless otherwise specified by specific indicators. Redox depletions. Bodies of low chroma (2 or less) having value of 4 or more where Fe-Mn oxides have been stripped or where both Fe-Mn oxides and clay have been stripped. Redox depletions contrast distinctly or prominently with the matrix. Redoximorphic features. Features formed by the processes of reduction, translocation, and/or oxidation of Fe and Mn oxides; formerly called mottles and low-chroma colors. Reduced matrix. A soil matrix that has low chroma and high value, but in which the color changes in hue or chroma when the soil is exposed to air. *Sapric. See Muck Soil texture. The relative proportions, by weight, of sand, silt, and clay particles in the soil material less than 2 mm in size. *** All definitions taken from United States Department of Agriculture, Natural Resources Conservation Service. 2010. Field Indicators of Hydric Soils in the United States, Version 7.0. L.M. Vasilas, G.W. Hurt, and C.V. Noble (eds.). USDA, NRCS, in cooperation with the National Technical Committee for Hydric Soils.