Download

1 / 8
80 likes | 209 Views
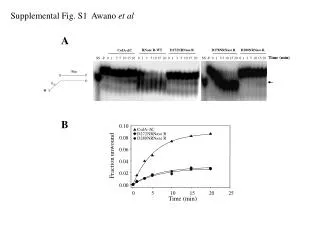
Supplemental Figures CAN 14-2043 Sahu et al. Fig Supplementary S1. Figure S1. Chemotherapy agents generate PAF-R agonist formation in human SK23MEL melanoma cells Lipid extracts were obtained from 5 x 10 6 SK23MEL cells treated with 100 m g/ml

E N D
Fig Supplementary S1 Figure S1. Chemotherapy agents generate PAF-R agonist formation in human SK23MEL melanoma cells Lipid extracts were obtained from 5 x 10⁶ SK23MEL cells treated with 100 mg/ml of chemotherapeutic agents, or 0.5% DMSO vehicle for various times, and tested for total PAF-R agonistic activity using PAF-R-positive KBP cells loaded with the calcium-specific dye Fura-2. The data are the Mean ± SE percentage of peak intracellular calcium response as a percentage of that induced by 1 mM CPAF from at least three separate experiments. * Denotes statistically significant (P <0.05) changes in levels of PAF-R agonist activity from control values.
Figure S2. Left flank tumor growth: effect of chemotherapy and antioxidants on the growth of treated tumors. WT & PAFR-KO (Ptafr-/-) mice were placed on regular (NL) or antioxidant diet as in Fig. 3 for 10 days before implantation of dual B16F10 tumors, followed by intratumoral treatment with A) 36 mg/kg etoposide (n=9-12), or B) 15 mg/kg melphalan (n=9-11), or vehicle (n=7-10) every 3 days starting at day 6. The data depicted are the mean tumor volumes ± SE at Day 17 post-tumor implantation of tumors treated with chemotherapy, or vehicle, implanted on the left flank. Between WT & PAFR-KO mice, there were no statistically significant differences in the growth of chemotherapy- or vehicle-injected tumors. Moreover, there were no differences in the growth of the left flank tumors in response to vehicle treatment of the contralateral tumors. Fig Supplementary S2
A B Fig Supplementary S3
Figure S3. Effect of antioxidants on the etoposide-mediated increased tumor growth. WT & PAFR-KO (Ptafr-/-) mice were placed on antioxidant diet as in Fig. 3 for 10 days before placement of dual B16F10 tumors, followed by intratumoral treatment with A) 36 mg/kg etoposide (n=9-12) or B) 15 mg/kg melphalan (n=9-11) or vehicle (n=7-10) every 3 days starting at day 6. The data depicted are the mean ± SE of tumor volume of untreated tumors at Day 16 post-tumor implantation, in which the contralateral tumor was treated with etoposide. Antioxidants treatment did not affect the growth of undisturbed tumor in PAFR-KO mice. Statistical changes were noted between undisturbed tumor growth in WT and PAFR-KO mice treated with etoposide (P < 0.1) or melphalan(P < 0.01) on regular diet.
Fig Supplementary S4 Figure S4. CPAF and COX-2 inhibitor have no effect on B16F10 tumor growth in PAF-R- deficient mice. PAFR-KO (Ptafr-/-) mice implanted with a single tumor were treated at day 0 and every 3 days with ip injections of CPAF (250 ng) or vehicle or COX-2 inhibitor SC-236 (200 ng). Tumor growth was assessed over time as in Fig 4. The data depicted are the mean ± SE of tumor volume over time in 4-5 mice per experimental group.
Fig Supplementary S5 Figure S5. COX-2 inhibitor blocks etoposide-mediated augmentation of tumor growth. WT mice implanted with two tumors were treated with SC-236 (200 ng) or vehicle at day 0 and every 3 days, and underwent intratumoral treatment with PBS vehicle (n=11-13) or 36mg/kg etoposide (n=12-14) every 3 days starting at day 6. Tumor growth was assessed over time as in Fig 4. The data depicted are the mean ± SE of tumor volume of untreated tumors over time in which the contralateral tumor was treated with etoposide. Statistically significant differences were noted in tumor volumes (* P<0.05 and # P<0.1).
Fig Supplementary S6 Figure S6. Effect of COX-2 inhibitor on tumoralTreg levels. A group of FoxP3EGFP WT mice (n=6-9) were implanted with a single B16F10 tumor followed by treatment either with COX-2 inhibitor (SC-236, 200ng) or vehicle (PBS, 100µl) i.p. starting at day 0 and repeated every 3 days until day 15. CPAF/vehicle treatments were given at day 0, 6 and 12. Mice were sacrificed at days 6, 9, 12, 15 and 18 and tumors harvested and processed for the analysis of EGFP positive cells as a surrogate marker for Tregs by flow cytometry and qPCR studies. A) Data (flow cytometry) are the Mean ± SE of EGFP+ cells (normalized to vehicle control mice) in CPAF and SC-236 + CPAF groups in tumors over the period of time. B) A representative flow analysis for tumoralEGFP+ cells at day 9 in CPAF and SC-236 + CPAF groups are shown. C) qPCR analysis for the EGFP mRNA normalized to CD3e in the CPAF and SC-236 + CPAF groups are shown. * Denotes statistically significant difference (P<0.05) between CPAF versus SC-236 + CPAF groups.