Download
1 / 30
300 likes | 416 Views
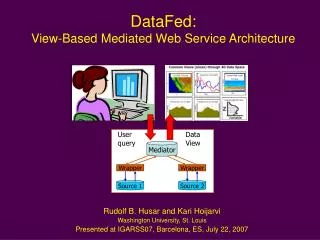
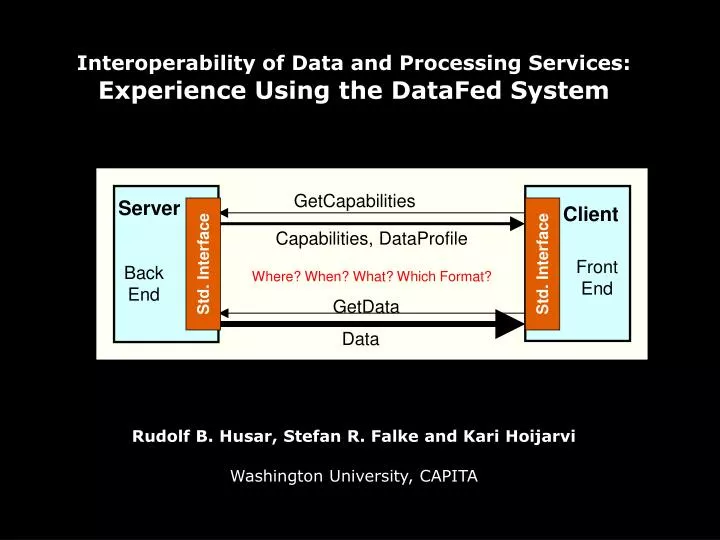
GetCapabilities. Server. Std. Interface. Std. Interface. Client. Capabilities, DataProfile. Front End. Back End. Where? When? What? Which Format?. GetData. Data. Interoperability of Data and Processing Services: Experience Using the DataFed System.

E N D
GetCapabilities Server Std. Interface Std. Interface Client Capabilities, DataProfile Front End Back End Where? When? What? Which Format? GetData Data Interoperability of Data and Processing Services:Experience Using the DataFed System Rudolf B. Husar, Stefan R. Falke and Kari Hoijarvi Washington University, CAPITA
Outline • DataFed in a Nutshell • Information Engineering: Data Control and Data Flow • Web Coverage Service (WCS) for Ubiquitous Data Access • Summary
Federated Network for Air Quality Data and Processing Services Software Architecture (00-05) : R. Husar Software Implementation (01-04): K. Höijärvi Data and Applications (03-05): S. Falke, R. Husar
Explore Data Info Needs Federate Data Understand Providers Viewers Emission Surface Satellite Model Single Datasets Reports Slice & Dice Programs AQ Compliance Nowcast/Forecast Status & Trends Find Data Gaps ID New Problems ……… Wrappers Structuring Integrate What? When? Where? • The info system infrastructure needs to facilitate the creation of info products • Providers supply the ‘raw material’ (data and models) for ‘refined’ info products • The challenge is to design a general supportive infrastructure Data Users Data Providers Non-intrusive Linking & Mediation • Simply connecting the relevant provides and users for each info product is messy • Structuring the heterogeneous data into where-when-what ‘cubes’ simplifies the mess • The ‘cubed’ data can be accessed and explored by slicing-dicing tools • More elaborate data integration and fusion can be done by web service chaining • This infrastructure support for IDAQ can be provided by the ESIP Federation Integrated Data System for Air Quality-IDAQ ESIP AQ Cluster 050510 Draft rhusar@me.wustl.edu
Some of the Tools Used in FASTNET • Data Catalog • Data Browser • PlumeSim, Animator • Combined Aerosol Trajectory Tool (CATT) Consoles: Data from diverse sources are displayed to create a rich context for exploration and analysis Viewer: General purpose spatio-temporal data browser and view editor applicable for all DataFed datasets CATT: Combined Aerosol Trajectory Tool for the browsing backtrajectories for specified chemical conditions
A Sample of Datasets Accessible through ESIP MediationNear Real Time (~ day) It has been demonstrated (project FASTNET) that these and other datasets can be accessed, repackaged and delivered by AIRNow through ‘Consoles’ MODIS Reflectance MODIS AOT TOMS Index MODIS Fire Pix GOES AOT GOES 1km Reflec NEXTRAD Radar NWS Surf Wind, Bext NRL MODEL
Data Access Data Processing Layer Overlay LAYERS NASA SeaWiFS Satellite RPO VIEWS Chemistry NOAA ATAD Trajectory OGC Map Boundary WS Benefits:Composition of Data Views from Distributed Data and Web Services Web Service Composition
Web Services: Building Blocks of DataFed ProgrammingAccess, Process, Render Data by Service Chaining [Station] Map boundary layer Clickable monitor locations layer [Monitor]
Service Flow Program for a VIEW View • <ServiceFlow> • <View> • <MapImageMargin ref="ws_margins" /> • <AnnotateImage ref="ws_title" icon_text="T" label="Title" execute="true" /> • <StockAnnotation ref="DATAFED" /> • <StockAnnotation ref="CIRA" /> • <AnnotateImage ref="ws_cursor_annotation" icon_text="C" label="Cursor" execute="true" /> • </View> • <Layers current="Traj_Grid" order="Traj_Grid Traj_Point Traj_Line MapImage_1"> • <Layer id="Traj_Line" dataset_abbr="VIEWS_OL" visible="false" visibility="1" click_target="true"> • <DataMapTimePoint ref="ws_data" label="Query Filter" /> • <DataMapTrajectory ref="ws_traj_render" show_data="false" icon_text="TR" /> • <AnnotateImage ref="ws_network_legend" icon_text="N" label="Network Legend" execute="true" execute_always="true" /> • </Layer> • <Layer id="Traj_Point" dataset_abbr="VIEWS_OL" visible="true" visibility="1" click_target="true"> • <DataMapPoint ref="ws_point_data" show_data="false" /> • <DataMapPoint ref="ws_store_cursor_value" /> • <RenderMapPoint ref="ws_point_render" icon_text="RP" label="point rendering" /> • <MapParamLocationAccessRender ref="ws_loc" execute_always="true" /> • <RenderLegend ref="ws_pntleg" icon_text="L" label="Point Legend" execute="true" execute_always="true" /> • </Layer> • <Layer id="Traj_Grid" dataset_abbr="VIEWS_OL" visible="true" visibility="1"> • <DataMapTimePoint ref="ws_ref_data" label="Reference Query Filter" /> • <DataMapTrajectory ref="ws_ref_traj_grid" icon_text="TG" /> • <DataMapTimePoint ref="ws_data" label="Query Filter" /> • <DataMapTrajectory ref="ws_traj_grid" icon_text="TG" /> • <MapGridOperator ref="ws_mgo" /> • <RenderMapGrid ref="ws_rg" /> • <RenderLegend ref="ws_rainbow" icon_text="L" label="Rainbow Legend" execute="true" execute_always="true" /> • </Layer> • <Layer id="MapImage_1" dataset_abbr="MapImage" visible="true" visibility="1"> • <MapImageAccessRender ref="ws_map_image" /> • </Layer> • </Layers> • </ServiceFlow> Layer Layer Layer Layer
DataFed in a Nutshell DataFed Goals Facilitate access and flow of AQ data from provider to users Support user-driven data processing value chains Participate in specific application projects Approach: Mediation Between Users and Data Providers DataFed assumes spontaneous, autonomous data providers Non-intrusively wraps datasets for access by web services Mediates, homogenizes data views. e.g. geo-spatial, time... Applications Browsers and analysis tools for distributed monitoring data Serve as data gateway for user programs; GIS, science tools DataFed is focused on the mediation of air quality data
NAS, CAAAC CASAC, OMB PM research GEOSS NOAA EPA NASA PHASE Eco-informatic Test beds CDC Private Sector Organizations Stakeholders People Programs Actions Risk/exposure assessments NPS AQ forecasting USDA States/Tribes/RPO’s Interstate orgs. Accountability/ indicators NAAQS setting NARSTO DOE Enviros SIPs, nat. rules designations Academia NADP Satellite data IMPROVE, NCore PM monit, PAMS Intensive studies PM centers Supersites Data sources CASTNET Health/mort. records Other networks: SEARCH, IADN.. Lidar systems Emissions Meteorology CMAQ GEOS-CHEM Coordination Cluster Mess The Dependency Puzzle? Forces for Information Flow? Info System of Systems?
Control Public & Spec. Groups Information Societal Benefits Set up Organizations Actionable Knowledge Create Programs Comission Data as Information Data Sources Information Flow Control Public, Spec. Groups Mandate, $$ Decision, Action Judge, Decide, Act Organizations Have $$, Manage Goal, $$ Info, Guidance Analyze, Report Programs Provide Info to Orgs Data need $$ Raw Data Measure, Organize Data Systems Provide Data to Progs
Data Value – Sum of Values to Programs Public Org Org Prog Prog Prog Prog Dat Dat Dat Dat Dat Dat Dat Dat Dat Dat Information is non-depletive – can not be ‘used up’ Information re-use leads to the ‘network effect’ Total Info value is increased with use – NOT a zero sum game Data Valuei= S(Progj x Valuej)
Flow of Data Flow of Control Partners • NASA • NOAA • EPA • (?) • USGS • DOE • NSF • Industry… Earth Science Information Partners Air Quality ClusterTechTrack Air Quality Information System Architecture Data Products Mediators Knowledge Products Informing Public Air Quality Data AQ Compliance Data to Knowledge Transformation Meteorology Data Network Assess. Status and Trends Emissions Data Tracking Progress (intended as background for AQ Cluster discussions)
Interoperability Wrappers and Adapters
4D Data Model Physical Data Model Abstract Data Model
T1 T2 Generic Data Interoperability Client-Server Communication Protocol GetCapabilities Server Std. Interface Std. Interface Client Capabilities, DataProfile Front End Back End Where? When? What? Which Format? GetData Data Data Coding Geo-reference Time-code Std names Model, format
GetCapabilities Server Std. Interface Std. Interface Client Capabilities, DataProfile Front End Back End Where? When? What? Which Format? GetData Data T1 T2 Generic Data Interoperability Client-Server Communication Protocol Data Coding Geo-reference Time-code Std names Model, format
Data Interoperability Groups, Activities Interoperability Stack and Connectivity Example Protocol Stack Composition: Data Access: Metadata: Data Formats: Server BPEL, AJAX, .Net SOAP, OGC-W*S CF, EOS, OGC-W*S netCDF, HDF, geoTIFF Client JScript, .Net, AJAX OGC-WCS CF netCDF, GRIB
Services are self-describing through “Capabilities” and “Description” docs Filter parameters allow selection of subsets of source data Output formats advertised by each service instance HTTP GET/POST based interfaces OGC Services Web Map Service Web Feature Serv. Web Coverage Serv. WMS Maps Format: Image WFS Feature – road Format: GML WCS coverage data Format:Grid, Table <Roads> <Road> <gml:name>M11</gml:name> <gml:centerLineOf> <gml:LineString srsName="EPSG:4326"> <gml:coordinates> 0,5.0 20.6,10.7 80.5,60.9 </gml:coordinates> </gml:LineString> </gml:centerLineOf> EOS HDF, netCDF, RichTable
HTTP GET/POST based interfaces Services have XML service descriptions (“Capabilities”, “Description”) Filter parameters allow selection of subsets of source data Output formats advertised by each service instance OGC Web Coverage Service (WCS) Specification WCS is for "coverages" – information representing space-time-varying phenomena WCS describes, requests and deliverscoverages in spatio-temporal domain WCS version 1.1 is limited to grids/"simple” coverages with homogeneous range sets OGC WCS getCoverage SchemaSuitable for wrapping with SOAP envelope, WSDL access, loose coupling
DataFed WCS Server for Point Observation Data The current version of WCS (1.0) only supports grid and image data types. Coverages can include other representations of space-time varying phenomena, such as observations from an air quality monitoring network. An example WCS query for a point dataset in DataFed is:http://webapps.datafed.net/dvoy_services/ogc.wsfl?SERVICE=wcs&REQUEST=GetCoverage&VERSION=1.0.0&CRS=EPSG:4326&COVERAGE=AIRNOW.pmfine&FORMAT=CSV&BBOX=-125,22,-61,51,0,0&TIME=2005-06-27T15:00:00Z&WIDTH=999&HEIGHT=999&DEPTH=999 &BBOX=-100,22,-100,22,0,0&TIME=2005-06-20T00:00:00Z/2005-06-30T23:00:00Z
Benefits of WMS Compatibility: Geospatial One-Stop Provides Access to DataFed spatial layers through WMS Problem: No Time Dim! DataFed/VIEWS Asian Dust Concentration (circles) S. Falke http://www.datafed.net/DataLinks/OGC/OGC.htm
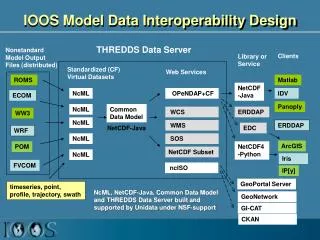
WMS Data View Services WCS SOS SOS SensorML WMS WFS Stations Observations Par-Meth Star Schema Param/Sensor/Method Station Info. Relational Data Model Observations
WCS Query for Map, Time and Elevation Views Lat/Lon Box Elev Range Time Range Map: BBOX=-180,-90,180,90, 1350,1350& TIME=2005-12-06/2005-12-06/PT3H Time: BBOX=-34,49.05,-34,49.05, 1350,1350& TIME=2005-12-05/2005-12-08/PT3H Elev: BBOX=-34,49.05,-34,49.05, 0,18000 & TIME=2005-12-06/2005-12-06/PT3H The form of the WCS query is the same for all slices through the data cube (views) The only difference in the views is the thickness of the slices in each dimension
WCS Query for Map Views from Various Sites Coverage=THEEDDS.T& BBOX=-126,24,-65,52,0,0 &TIME=2002-07-07/2002-07-07&FORMAT=NetCDF Coverage=SURF.Bext& BBOX=-126,24,-65,52,0,0 &TIME=2002-07-07/2002-07-07&FORMAT=NetCDF-table Coverage=SEAW.Refl& BBOX=-126,24,-65,52,0,0 &TIME=2002-07-07/2002-07-07&FORMAT=GeoTIFF COVERAGE=sst& BBOX=-126,24,-65,52,0,0 &TIME=2001-01-01,2001-01-01&FORMAT=NetCDF UNIDATA – THREDDS/GALEON WCS DataFed GALEON WCS U Florence, It GALEON WCS DataFed GALEON WCS
Wind Data for GEOSS Services Network (GSN) Beijing Demo (see More)G. Rutledge (NOAA-NSDC), B. Domenico (Unidata), R. Husar (Wash U.) Portrayal & Chaining Services Data Access Services Appliation Internet Forecast Meteorology Unidata WCS Server Archived Meteorology NCDC WCS Server DataFed WMS Server GSN Beijing WMS Client Other Data Station, Image Other WMS, WCS rhusar@me.wustl.edu 060410
Trajectory Service Chain Demo B. Domenico (Unidata), G. Rutledge (NOAA-NCDC), R. Husar (Wash U.) 4D Wind Field Wind Field Subset Single Trajectory Multi-Trajectory Forward Traj Model Wind Servers Receptor Backward Traj Plume Portray OverlayRender GMU? WCS Data Access Service Single Traj. Service Traj. Aggregator Access to Forecast & Archived Winds Unidata & NOAA Trajectory Algorithms: NOAA HYSPLIT CAPITA Monte Carlo Trajectory Filtering & Aggregation Based on Chemical Conditions rhusar@me.wustl.edu 060622
Summary Suitable for most data view queries BBOX, TIME Applicable to most data types Station, Image, Grid OGC WCS protocol is suitable for delivering most air quality data Need WCS Interface to Satellite Data Station-Point SQL Server, Files… SequenceImage, file nDim GridOpenDAPNetCDF, … WCS Issues • WCS: Add Point coverage to WCS (in addition to grid, polygon) • WCS: Strongly typed (XML Schema-verifiable) return data types • Testing: Much fixing and testing for server-client compatibility