Download
1 / 10
140 likes | 369 Views
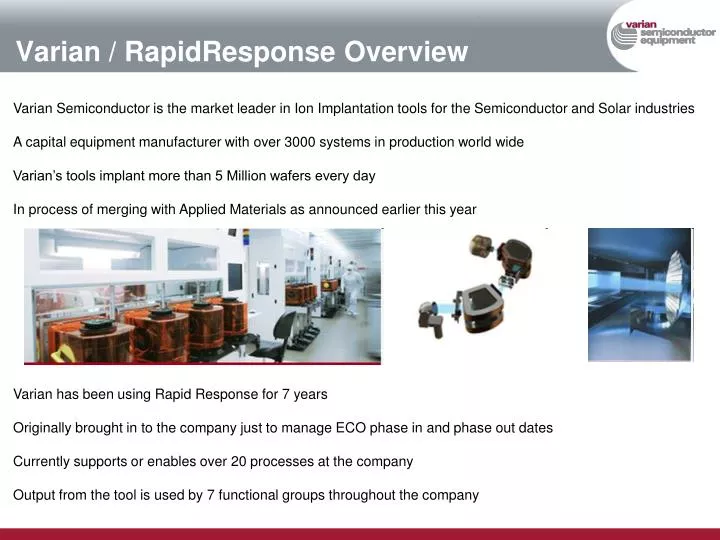
Varian / RapidResponse Overview. Varian Semiconductor is the market leader in Ion Implantation tools for the Semiconductor and Solar industries A capital equipment manufacturer with over 3000 systems in production world wide Varian’s tools implant more than 5 Million wafers every day

E N D
Varian / RapidResponse Overview Varian Semiconductor is the market leader in Ion Implantation tools for the Semiconductor and Solar industries A capital equipment manufacturer with over 3000 systems in production world wide Varian’s tools implant more than 5 Million wafers every day In process of merging with Applied Materials as announced earlier this year Varian has been using Rapid Response for 7 years Originally brought in to the company just to manage ECO phase in and phase out dates Currently supports or enables over 20 processes at the company Output from the tool is used by 7 functional groups throughout the company
Monitoring LiabilityAgreementsBackground/Setup • Varian has entered into contractual agreements with 49 different suppliers where: • Supplier agrees to hold some level of finished goods or WIP • Varian agrees to pay for the material if not consumed • The lead time of the components to Varian can then be reduced • Needed a way to monitor how well these suppliers ACTUAL inventory and WIP quantities were aligned to the contractual levels: • A glass pipeline view would have been ideal but would be impossible to set up with so many suppliers in a reasonable time frame • Rapid Response’s Advance Alert functionality provided a method to collect the desired data on a regular basis (currently every other week) • Data is updated daily as part of the Rapid Response refresh • Additional benefit: the data can now be used to perform additional analysis • One time setup: • The maximum contractual liability level was already being tracked in an SAP “Z” table (could be any source) • This table was mapped to a Rapid Response user defined table • User “Alert” accounts were set up for each supplier • A profile variable was set up for each supplier that keyed off of supplier #
Monitoring LiabilityAgreementsProcess This is the workbook view that is sent to each supplier: It is filtered with the profile variable that defines the supplier’s parts So each supplier will only see the data associated with their supplier number
Monitoring LiabilityAgreementsProcess Then an Advanced Alert is used to send a “customized report” to each supplier with just their data every other week (All of these techniques are covered in the Kinaxis training course “Authoring Advanced”) The suppliers send their current stocking / WIP levels back to our contact person and/or the buyer for the parts and they update the Z table in SAP so the next day’s Rapid Response refresh reads in the latest data 44 of the 49 suppliers actively participate in this feedback process, (The others have no parts with a prescribed finished goods level so the process does not apply.)
Adjusting the level and utilizing the data The supplier feedback form not only shows the current contractual finished goods level but also out “desired” level for the future After the supplier fills in the middle 2 yellow columns, we ask that they comment in the last column on any parts that are not between the current and desired levels Then by comparing their stocking levels to the planned orders for the parts in Rapid Response we’re able to put together this dashboard view
The Dashboard Here is a closer view of the dashboard After the supplier fills in the middle 2 yellow columns, we ask that they comment in the last column on any parts that are not between the current and desired levels • The color coding indicates how the FG Qty will be consumed: • Yellow = between contractual and desired level • Green = at or below desired level • Blue = all supply consumed Then by comparing their stocking levels to the planned orders for the parts in Rapid Response we’re able to put together this dashboard view
Forecasting Consumption of Off Book Liability for Quarterly Inventory Obsolescence Review Using these burn off calculations for our off book liability (see prior slide) we have developed at VSEA the view below to summarize the dollars that are not forecasted to burn off by various points in time. We use this data to make inventory reserve decisions and to review this liability with auditors at the end of each quarter. The $’s remaining at the end of each of the time periods for the obso review are summarized Then in a separate scenario in Rapid Response we change all of our outsourced sub-assemblies from buys to makes so we can see any parts that may get consumed by our subcontract manufacturers Any parts that are not consumed fully are reviewed by Supply Line Management for accuracy and then the supplier is contacted for potential settlement of the liability
Analyze Our Ability to Support New Drop-In Demands We also use the liability data to analyze our ability to support drop-in demand, inside of lead time Below is our FlatBOMDown-DropIns tool that we use to analyze these demands: Filter Here Assy to be added Any Finished Goods Qty’s are highlighted in brown Best date ARO based on LT of this component • After entering the assembly number that is being requested on the left • The table shows the gating components and their best ARO date based on LT • Parts which have finished goods quantities are highlighted in brown • The data can then be filtered to account for excess on hand or on order and improve the date • If the date is still not soon enough, this supply consumption can be used to make trade-offs • Let’s work through an example!!!!!!
Inventory Commit By Product line Graphs We have developed at VSEA these graphs to summarize our material commitment, tool by tool, for several of our product models. This view leverages a version of the Supply Consumption view and a scenario which has the parts on Liability agreements imaged as on order. The data is extracted with an alert and run through an access database to merge the latest tool data from Notes. Sample output for Platform XXX • Sample output • Our commitment is bucketed for each tool: • On Hand • On Order • Liability Agreement • Planned Order • Material not consumed at all is bucketed in the last bar