Download

1 / 17
170 likes | 180 Views
2.1a Polynomial Functions Linear Functions Linear Correlation/Modeling. Lots of new/old info. to start our next chapter!!!. Polynomial Functions – What are they?. Definition: Polynomial Function. Let n be a nonnegative integer and let

E N D
2.1a Polynomial FunctionsLinear FunctionsLinear Correlation/Modeling Lots of new/old info. to start our next chapter!!!
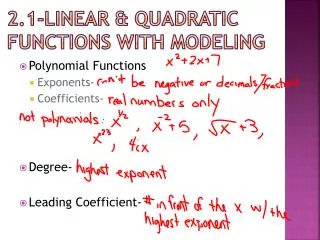
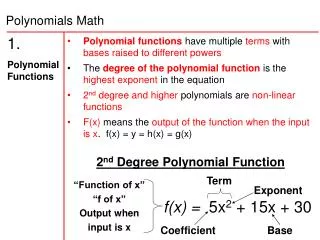
Polynomial Functions – What are they? Definition: Polynomial Function Let n be a nonnegative integer and let be real numbers with . The function given by is a polynomial function of degree n. The leading coefficient is . The zero function is a polynomial function. It has no degree and no leading coefficient.
Identifying Polynomial Functions Which of the following are polynomial functions? For those that are polynomial functions, state the degree and leading coefficient. For those that are not, explain why not. A polynomial function!!! Degree 3, leading coeff. 4 Not a polynomial function!!! The exponent – 4 messes everything up!!!
Identifying Polynomial Functions Which of the following are polynomial functions? For those that are polynomial functions, state the degree and leading coefficient. For those that are not, explain why not. Not a polynomial function!!! Cannot be simplified to polynomial form!!! Can we simplify this one? A polynomial function!!! Degree 4, leading coeff. –2
Polynomial Functions of No and Low Degree (some familiar ones?) Name Form Degree Zero Function Undefined Constant Function 0 Linear Function 1 Quadratic Function 2 Today we’ll focus mainly on this one…
Linear Function: f (x) = ax + b (where a and b are constants, and a is not equal to zero) A line in the Cartesian plane is the graph of a linear function if and only if it is a slant line, that is, neither horizontal or vertical. EX: Write an equation for the linear function f such that f (–1) = 2 and f (3) = –2. This is the “Do Now”!!! Points: Slope: Point-Slope Form: f (x) = –x + 1
Average Rate of Change The average rate of change of a function between x = a and x = b, if a and b are not the same, is Does this equation look familiar??? SLOPE!!! Constant Rate of Change. A function defined on all real numbers is a linear function if and only if it has a constant nonzero average rate of change between any two points on its graph. The slope m in the formula f (x) = mx + b is the rate of change of the linear function.
Characterizing the Nature of a Linear Function Point of View Characterization Verbal Polynomial of degree 1 Algebraic Graphical Slant line with slope m and y-intercept b Analytical Function with constant nonzero rate of change m: f is increasing if m > 0, decreasing if m < 0; initial value of the function = f (0) = b
Linear Correlation and Modeling When the points of a scatter plot are clustered along a line, we say there is a linear correlation between the quantities represented by the data. Positive correlation – if the “cluster line” has positive slope Negative correlation – if the “cluster line” has negative slope (Linear) correlation coefficient (r) – measures the strength and direction of the linear correlation of a data set
Properties of the Correlation Coefficient 1. 2. When r > 0, there is a positive linear correlation 3. When r < 0, there is a negative linear correlation 4. When |r| is near one, there is a strong correlation 5. When r is near zero, there is weak or no linear correlation
Estimating Linear Correlations Strong positive linear correlation Weak positive linear correlation
Estimating Linear Correlations Strong negative linear correlation Weak negative linear correlation
Estimating Linear Correlations Little or no linear correlation
Let’s Try a Regression Problem! Steps for Regression Analysis 1. Enter and plot the data (scatter plot). 2. Find the regression model that fits the problem situation. 3. Superimpose the graph of the regression model on the scatter plot, and observe the fit. 4. Use the regression model to make the predictions called for in the problem.
Let’s Try a Regression Problem! Weekly Sales Data for Boxes of Cereal Use these data to write a linear model for demand (in boxes sold per week) as a function of the price per box (in dollars). Describe the strength and direction of the linear correlation. Then use the model to predict weekly cereal sales if the price is dropped to $2.00 or raised to $4.00 per box. Price per box Boxes sold $2.40 38,320 $2.60 33,710 $2.80 28,280 $3.00 26,550 $3.20 25,530 $3.40 22,170 $3.60 18,260
Let’s Try a Regression Problem! Weekly Sales Data for Boxes of Cereal Enter the data (price in L1, boxes sold in L2) and draw a scatter plot. Price per box Boxes sold $2.40 38,320 $2.60 33,710 $2.80 28,280 $3.00 26,550 $3.20 25,530 $3.40 22,170 $3.60 18,260 Use your calculator to obtain a linear regression equation: The correlation coefficient indicates a strong negative linear correlation:
Let’s Try a Regression Problem! Weekly Sales Data for Boxes of Cereal Graph the regression line on top of the scatter plot, and then calculate y at x = 2.00 and 4.00: Price per box Boxes sold $2.40 38,320 $2.60 33,710 $2.80 28,280 $3.00 26,550 $3.20 25,530 $3.40 22,170 $3.60 18,260 At a price of $2.00, approximately 42,905 boxes of cereal would be sold. At $4.00, the number sold drops to approximately 12,187. Homework: p. 175-177 1-17 odd