Download
1 / 14
140 likes | 288 Views
Impact of Argo Salinity Observations on Ocean Analyses. Chaojiao Sun , Michele Rienecker Christian Keppenne, Jossy Jacob, Robin Kovach NASA/GSFC Global Modeling and Assimilation Office (GMAO). Acknowledgement: Gregg Johnson (TAO servicing cruise data)

E N D
Impact of Argo Salinity Observations on Ocean Analyses Chaojiao Sun, Michele Rienecker Christian Keppenne, Jossy Jacob, Robin Kovach NASA/GSFC Global Modeling and Assimilation Office (GMAO) Acknowledgement: Gregg Johnson (TAO servicing cruise data) Willa Zhu (retrieving recent TAO servicing cruise data) Dave Behringer (quality-controlled XBT data)
Motivation Previous studies have shown that assimilating temperature and synthetic salinity has an impact on salinity and current fields (Sun et al., 2006).
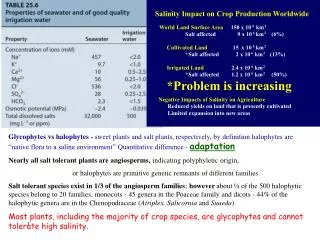
Purpose: To assess the impact of Argo salinity assimilation on ocean analyses using independent salinity observations. • Experiment details: 2000-2004, focusing on the last year 2004 • Experiment 1 (“ARGO”): assimilates Argo temperature and salinity, in addition to the assimilation of subsurface temperature observations and synthetic salinity profiles (where no Argo salinity data is available). • Experiment 2: (“NARGO”): no Argo data used, only subsurface temperature (XBT and moorings) observations and synthetic salinity profiles are assimilated. • Experiment 3: (“MODEL”): model simulation without any assimilation. • Observations • XBT (QC by NCEP/Dave Behringer) • TAO/TRITON/PIRATA (delayed mode, QC by PMEL) • Argo (delayed mode, QC by GODAE/Monterey server) • Forcing: + Atlas/SSMI time varying wind stress + E-P forcing, with P from GPCP monthly mean precipitation + NCEP CDAS1 SW (for penetrating radiation) & LH (for evaporation) + relaxation to Reynolds SST • Salinity analysis validation: independent observations • CTD casts from TAO servicing cruises
Observation and model errors Observation error estimates are based on the vertical temperature and salinity gradient, with the maximum and minimum specified as the following: Argo salinity error: minimum 0.03 psu, maximum 0.20 psu Synthetic salinity error: minimum 0.05 psu, maximum 0.30 psu. Temperature observation error: minimum 0.3oC, maximum 0.7oC. Model errors are assigned uniformly (based on ensembles model simulations): Temperature error: 0.77oC Salinity error: 0.20 psu Profile distribution and volume in 2004 in the tropical band of 10S-10N
180E; Dec 3-12 2004 TAO CTD casts: Jun 20-29,1004 ARGO analysis NARGO analysis MODEL simulation Note: color scale of model simulation and analyses does not exactly match that of CTD casts plotted at the EPIC website. Pink line denotes the mixed layer depth.
155W, 8S-12N TAO CTD casts: Jun 20-29,1004 ARGO analysis NARGO analysis MODEL simulation
155W, 8S-12N # of Argo obs. during Jun 20-29: 8 TAO CTD casts: Jun 20-29,1004 # of Argo obs. in Jun 2004: 26 # of Argo obs. Apr-May-Jun,2004: 67 Number of ARGO profiles during and before the CTD casts. Note that the same ARGO analysis is shown in all three analysis plots.
Mean and STD of differences between analysis, model simulation and independent CTD observations
Surface Salinity at Equatorial Pacific (2000-2004) TAO ARGO NARGO MODEL
Surface Salinity at 180W (2000-2004) ARGO NARGO MODEL
150m Salinity at 180W (2000-2004) ARGO NARGO MODEL
Conclusions • Argo makes a difference: • Synthetic salinity profiles derived from Levitus T-S climatology are useful in reducing subsurface model salinity bias. • Argo salinity observations reduce the impact of climatology of the synthetic salinity, introducing more subsurface variability than in the MODEL or NARGO cases • Argo salinity observations improve the comparison with independent CTD observations in the overall salinity structure [horizontal and vertical gradients] • Subsurface salinity assimilation impacts surface salinity distribution. • Aquarius: • Aquarius data will help: • validation • assimilation for the surface layers
Future work • Validate salinity at depth and currents • Assimilate available surface salinity data to evaluate the impact of surface salinity from Aquarius
GMAO treatment of salinity via TS – scheme: T and S assimilation • S comes from ARGO when available • Synthetic S(z) - T(z) is used with T-S relation from Levitus climatology to generate a synthetic S(z) “consistent” with temperature variations • No modification of salinity in the model’s surface mixed layer; salinity varies according to estimated E-P Climatology T(z) Climatology T(z) Climatology S(z) Observed T(z) Schematic of the derivation of synthetic salinity profiles.