Download
1 / 30
300 likes | 398 Views
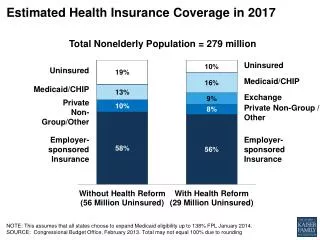
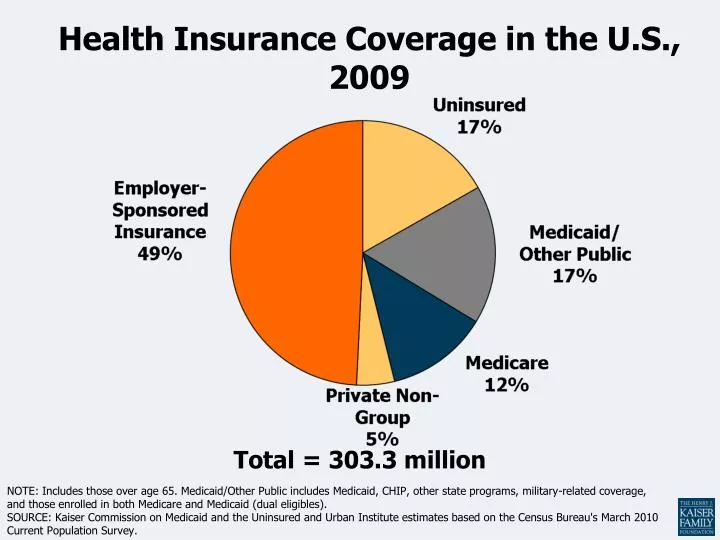
Health Insurance Coverage in the U.S., 2009. Total = 303.3 million.

E N D
Health Insurance Coverage in the U.S., 2009 Total = 303.3 million NOTE: Includes those over age 65. Medicaid/Other Public includes Medicaid, CHIP, other state programs, military-related coverage, and those enrolled in both Medicare and Medicaid (dual eligibles). SOURCE: Kaiser Commission on Medicaid and the Uninsured and Urban Institute estimates based on the Census Bureau's March 2010 Current Population Survey.
Nonelderly Uninsured by Poverty Levels and Age, 2009 Children Adults 8% <138% FPL Children 1% 139-399% FPL 10% 400%+ FPL 42% Adults 33% Adults 6% Children Total = 50.0 million uninsured Note: Federal Poverty Level (FPL) for a family of four in 2009 is $22,050/year. SOURCE: KCMU/Urban Institute analysis of 2010 ASEC Supplement to the CPS.
Health Insurance Coverage ofthe Nonelderly Population, 2009 Private Non-group 5% 264.7 Million SOURCE: Kaiser Commission on Medicaid and the Uninsured/Urban Institute analysis of 2010 ASEC Supplement to the CPS.
Health Insurance Coverage of the Nonelderly by Poverty Level, 2009 The federal poverty level (FPL) was $22,050for a family of four in 2009.Data may not total 100% due to rounding. SOURCE: KCMU/Urban Institute analysis of 2010 ASEC Supplement to the CPS.
Number of Nonelderly Uninsured Americans, 2000 – 2009 * The Census Bureau periodically revises its CPS methods, which means data before and after the revision are not comparable. Comparison across years can be made between 2000 through 2004, and 2004 though 2009. SOURCE: Kaiser Commission on Medicaid and the Uninsured/Urban Institute analysis of 2001-2010 ASEC Supplements to the CPS.
Number of Nonelderly Uninsured Americans, 2004 - 2009 Uninsured in Millions 50.0 46.5 44.4 45.7 45.0 43.0 SOURCE: Kaiser Commission on Medicaid and the Uninsured/Urban Institute analysis of March CPS for each year.
Characteristics of the Uninsured, 2009 Family Income Family Work Status Age Part-Time Workers 16% 55-64 10% 0-18 17% No Workers 23% 19-34 40% 35-54 33% 1 or More Full-Time Workers 61% Total = 50.0 million uninsured The federal poverty level was $22,050for a family of four in 2009. Data may not total 100% due to rounding.SOURCE: KCMU/Urban Institute analysis of 2009 ASEC Supplement to the CPS.
Nonelderly’s Health Insurance Coverage by Family Poverty Level, 2009 Number 88.7 M 400% + 73.5 M 200% - 399% 46.9 M 100% - 199% 55.6 M Under 100% NOTES: Data may not total 100% due to rounding. The Federal Poverty Level for a family of four in 2009 was $22,050 (according to the U.S. Census Bureau’s poverty threshold). Family size and total family income are grouped by insurance eligibility. SOURCE: Kaiser Commission on Medicaid and the Uninsured/Urban Institute analysis of 2010 ASEC Supplement to the CPS.
Nonelderly’s Health Insurance Coverage by Family Work Status, 2009 Number 37.1 M 24.1 M 135.4 M 68.2 M No workers Only part time One full-timeworker Two full-time workers NOTES: Data may not total 100% due to rounding. SOURCE: Kaiser Commission on Medicaid and the Uninsured/Urban Institute analysis of 2010 ASEC Supplement to the CPS.
Uninsured Rates Among Nonelderly by State, 2008-2009 NH VT WA ME MT ND MN MA OR NY WI SD ID RI MI CT WY PA NJ IA NE OH NV IN IL DE UT WV VA MD CO CA KS MO KY DC NC TN OK SC AR AZ NM GA AL MS AK TX LA FL HI <14% Uninsured (13 states & DC) National Average = 18.1% 14 to 18% Uninsured (20 states) >18% Uninsured (17 states) SOURCE: Kaiser Commission on Medicaid and the Uninsured/Urban Institute analysis of 2009 and 2010 ASEC Supplements to the CPS., two-year pooled data.
Children’s Health Insurance Coverage by Family Poverty Level, 2009 Number 400% + 20.3 M 200% - 399% 21.7 M 100% - 199% 15.8 M 21.5 M Under 100% NOTES: The Federal Poverty Level for a family of four in 2009 was $22,050 (according to the U.S. Census Bureau’s poverty threshold). Family size and total family income are grouped by insurance eligibility. Children includes all individuals under age 19.SOURCE: Kaiser Commission on Medicaid and the Uninsured/Urban Institute analysis of 2010 ASEC Supplement to the CPS.
Access to Employer-Based Coverage by Family Income, 2005 (Family Income <100% FPL) (Family Income 400%+ FPL) NOTE: The Federal Poverty Level (FPL) was $16,090 for a family of three in 2005. SOURCE: Garrett B. and L. Clemens-Cope. Changes in Employer-Sponsored Health Insurance Coverage: 2001-2005. Kaiser Commission on Medicaid and the Uninsured report #7599, Dec. 2006
Children’s Access to Care, by Health Insurance Status, 2009 * In the past 12 months NOTE: Questions about dental care were analyzed for children age 2-17. MD contact includes other health professionals. Respondents who said usual source of care was the emergency room were included among those not having a usual source of care. SOURCE: Kaiser Commission on Medicaid and the Uninsured analysis of 2009 NHIS data.
Barriers to Health Care Among Nonelderly Adults, by Insurance Status, 2009 Percent of adults (age 18 – 64) reporting: * In past 12 months.Respondents who said usual source of care was the emergency room were included among those not having a usual source of care.SOURCE: KCMU analysis of 2009 NHIS data.
Diagnosis of Late-Stage CancerUninsured vs. Privately Insured Ratio of probability of diagnosis of late vs. early stage cancer, Uninsured/private insurance Equal likelihood between Uninsured and Insured NOTE: Odds ratios were adjusted for age, sex, race/ethnicity, facility type, region, and income and education on basis of postal code. They represent the odds of being diagnosed with stage III or state IV cancer vs. stage I cancer. Analysis based on cases occurring between 1998-2004. SOURCE: Kaiser Family Foundation, based on Halpern MT et al, Association of insurance status and ethnicity with cancer stage at diagnosis for 12 cancer sites: a retrospective analysis." The Lancet Oncology. March 2008.
Cumulative Change in Single and Family Health Insurance Premiums and Federal Poverty Level, 1996-2009 * * *No data are available for 2007 due to MEPS transition from retrospective to current data collection. Note: Family premium percentages were calculated based on a family of four. In 2009 and 2010, the federal poverty level for a family of four was $22,050. Source: Premium data from Agency for Healthcare Research and Quality, Medical Expenditure Panel Survey, private sector data from Insurance Component, 1996-2009, at http://www.meps.ahrq.gov/mepsweb/. Federal Poverty Level based on HHS Federal Poverty Guidelines (1996 through 2009) at http://aspe.hhs.gov/poverty/figures-fed-reg.shtml; rate of growth based on change for one person (change for a four-person family would be 41.3% rather than 39.9% over the period).
Medicaid Managed Care and Traditional Enrollment, 1999-2009 Enrollment (in millions) 47.1 45.4 45.7 46.0 44.4 42.7 40.1 36.6 33.7 31.9 Note: Numbers may not produce totals because of rounding. Unduplicated count. Includes managed care enrollees receiving comprehensive and limited benefits. SOURCE: 2009 Medicaid Managed Care Enrollment Report. CMS.
Financial Consequences of Medical Bills by Insurance Status, 2009 Percent of adults (age 18-64) reporting in past 12 months: NOTE: All differences between insured and uninsured are statistically significant (p<0.05).SOURCE: Kaiser Family Foundation Health Tracking Poll: August 2009.
Figure 2: Among Adults with Employer-Sponsored Coverage or Nongroup Coverage in January 2006, Percent Uninsured in Each Month, January 2006 to December 2007 January 2006 January 2007 December 2007 Source: Kaiser Family Foundation analysis using data from U.S. Department of Health and Human Services, Agency for Healthcare Research and Quality, Medical Expenditure Panel Survey (MEPS), 2006 and 2007.
Figure 3: Among Adults with Medicaid in January 2006, Percent Uninsured in Each Month, January 2006 to December 2007 January 2006 January 2007 December 2007 Source: Kaiser Family Foundation analysis using data from U.S. Department of Health and Human Services, Agency for Healthcare Research and Quality, Medical Expenditure Panel Survey (MEPS), 2006 and 2007.
Figure 6: Among Adults Without Health Insurance in January 2006, Percent with Health Insurance in Each Month, January 2006 to December 2007 January 2006 January 2007 December 2007 Note: Family income is based on income in 2006. Source: Kaiser Family Foundation analysis using data from U.S. Department of Health and Human Services, Agency for Healthcare Research and Quality, Medical Expenditure Panel Survey (MEPS), 2006 and 2007.
Figure 5c: Among Children Without Health Insurance in January 2006, Percent with Health Insurance in Each Month, January 2006 to December 2007 January 2006 January 2007 December 2007 Note: Family income is based on income in 2006. Source: Kaiser Family Foundation analysis using data from U.S. Department of Health and Human Services, Agency for Healthcare Research and Quality, Medical Expenditure Panel Survey (MEPS), 2006 and 2007.
Impact of the Rise in Unemployment on Health Coverage, 2008 to 2009 3.0 2.8 Decrease in Employer Sponsored Insurance (million) = & 2.8% National Unemployment Rate Increase since 2008 (from 7.2% in Dec-08 to 10.0% in Nov-09) Medicaid /CHIP Enrollment Increase (million) Uninsured Increase (million) 6.9 Note: Totals may not sum due to rounding and other coverage. Source: Based on John Holahan and Bowen Garrett, Rising Unemployment, Medicaid, and the Uninsured, prepared for the Kaiser Commission on Medicaid and the Uninsured, January 2009.
Establishment Offer Rates by Size and Average Worker Earnings, 2000-2005 Offer Rate Average Worker Earnings Notes: Wages cutoffs are adjusted for inflation to 2005 dollars. Source: Kaiser Family Foundation calculations based on data from the National Compensation Survey, 2000-2005, conducted by the Bureau of Labor Statistics.
Among Workers in Firms Offering Health Benefits, Percentage of Workers Eligible, Who Take Up, and Covered by Health Benefits Offered by Their Firm, by Wage Level, 2008 Eligibility* Few Workers Are Lower-Wage (Less Than 35% Earn $22,000 a Year or Less) Many Workers Are Lower-Wage (35% or More Earn $22,000 a Year or Less) Take Up* Few Workers Are Lower-Wage (Less Than 35% Earn $22,000 a Year or Less) Many Workers Are Lower-Wage (35% or More Earn $22,000 a Year or Less) Coverage* Few Workers Are Lower-Wage (Less Than 35% Earn $22,000 a Year or Less) Many Workers Are Lower-Wage (35% or More Earn $22,000 a Year or Less) *Estimates are statistically different from each other within category (p<.05). Source: Kaiser/HRET Survey of Employer-Sponsored Health Benefits, 2008.
SOURCE: Based on a national survey conducted by the Center on Budget and Policy Priorities for the Kaiser Commission on Medicaid and the Uninsured, 2008. Nearly Two-Thirds of States Expanded Access to Medicaid and SCHIP, July 06 – January 08 Number of States With…
HMO Enrollment, by Model Type, 1984-2006 Enrollees (in millions) 80.1 78.0 74.2 70.0 71.4 66.1 63.3 72.7 38.8 31.4 15.1 Note: HMO enrollment includes enrollees in both traditional HMOs and point-of-service (POS) plans through: group/commercial plans, Medicare, Medicaid, the Federal Employees Health Benefits Program, direct pay plans, and unidentified HMO products. Enrollment by model type may not equal total enrollment because some plans did not report these characteristics. Data are as of June 30 or July 1 of respective year. Source: Kaiser Family Foundation, Trends and Indicators in the Changing Health Care Marketplace, 2002, May 2002, Exhibit 2.5, p.20, at http://www.kff.org/insurance/3161-index.cfm, based on July 1 data from InterStudy Publications, updated most recently with data from HealthLeaders-InterStudy, The Competitive Edge, Part II: Managed Care Industry Report, March 2007, Table 10, p.25.
Distribution of HMO Enrollment by Ownership Status, 1981-2006 Total Enrollment (in millions): Note: Some plans failed to report profit status and are excluded from the analysis. HMO enrollment includes enrollees in both traditional HMOs and point-of-service (POS) plans through: group/commercial plans, Medicare, Medicaid, the Federal Employee Health Benefits Program, direct pay plans, and unidentified HMO products. Data are as of June 30 or July 1 of respective year. Source: Kaiser Family Foundation, Trends and Indicators in the Changing Health Care Marketplace, 2002, May 2002, Exhibit 5.10, p. 57, at www.kff.org/insurance/3161-index.cfm, based on July 1 data from InterStudy Publications, updated most recently with data from HealthLeaders-InterStudy, The Competitive Edge, Part II: Managed Care Industry Report, March 2007, Table 10, p.25.
Growth in Workers by Type of Industry, 2000 to 2005 +5.6 million -2.0 million Growth in Workers in Industries where Employer-Sponsored Health Coverage is Less Common Decline in Workers in Industries where Employer-Sponsored Health Coverage is More Common Notes: Excludes those aged 65+. Uninsured rates are 23% in industries where coverage is less common, such as construction and agriculture; 10% where coverage is more common, such as education and manufacturing. Source: Urban Institute analysis of the 2001 and 2006 March CPS for KCMU, 2006.