Download

1 / 15
180 likes | 445 Views
Consumption & Saving Game. Definitions. Consumption function A function shows the relationship between planned consumption expenditure and disposable income in an economy. Saving function

E N D
Definitions • Consumption function • A function shows the relationship between planned consumption expenditure and disposable income in an economy. • Saving function • A function shows the relationship between planned savings and disposable income in an economy.
Definitions • Aggregate expenditure function • A function shows the relationship between planned aggregate expenditure andincome in an economy.
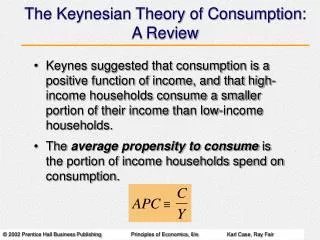
Definitions • Average propensity to consume (APC) • A ratio tells how much an economy spends on consumption for every dollar it earns. • Average propensity to save (APS) • A ratio tells how much an economy spends on saving for every dollar it earns.
Definitions • Marginal propensity to consume (MPC) • An index which tells how much of an increase in national income will be developed to increase consumption spending. • Marginal propensity to save (MPS) • An index which tells how much of an increase in national income will be developed to increase savings spending.
Income/ Expenditure Worksheet Monthly Expenditure on Consumption Monthly expenditure on savings Total Income
Discussion • Now, if we want to know how much the class wants to spend on consumption for every dollar it earns in a month, how can we find out? • We can calculate: • The proportion of C to income (Y) • A ratio of C/Y • Average Propensity to Consume (APC) • Similarly, the ratio of S/Y is called Average Propensity to Save (APS) which shows how much the class wants to spend on savings for every dollar it earns in a month.
APC & APS • APC + APS = 1 • APC and APS at certain level of income is the slope of the line joining from the origin to the consumption (savings) function at that certain level of income in an income-expenditure diagram.
Discussion • Now, we want to find out how much the class will spend if the total monthly income of the class increase $1? • We can calculate: • The change of income (∆Y) and the change of consumption (∆C) • ∆C /∆Y • Marginal Propensity to Consume (MPC) • Similarly, the ratio of ∆S /∆Y is called Marginal Propensity to Save (MPS).
MPC & MPS • MPC + MPS = 1 • MPC (MPS) is the slope of the consumption (savings) function in an income-expenditure diagram.
Discussion • What’s the slope of the consumption function called? • If the MPC is 0.7, what is the marginal propensity to save in a two-sector model? • What will happen to the class’s consumption function if the wealth of the class increases?
Discussion • What will happen to the consumption function if the interest rate increases? • What will happen to the consumption function if the marginal propensity to consume decreases?