Download

1 / 20
220 likes | 624 Views
Got Protein? Testing the protein content of common foods Bradford Protein Assay. Stan Hitomi Coordinator – Math & Science San Ramon Valley Unified School District Danville, CA Kirk Brown Lead Instructor, Edward Teller Education Center Science Chair, Tracy High School

E N D
Got Protein? Testing the protein content of common foods Bradford Protein Assay
Stan Hitomi Coordinator – Math & Science San Ramon Valley Unified School District Danville, CA Kirk Brown Lead Instructor, Edward Teller Education Center Science Chair, Tracy High School and Delta College, Tracy, CA Sherri Andrews, Ph.D. Curriculum and Training Specialist Bio-Rad Laboratories Essy Levy, M.Sc. Curriculum and Training Specialist Bio-Rad Laboratories Got Protein? Instructors
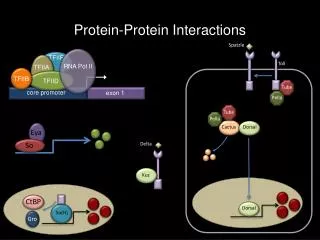
Why TeachGot Protein? • Powerful teaching tool • Laboratory extensions • Real-world connections • Link to careers and industry • Interdisciplinary – connects physics, chemistry and biology • Standards based
Got Protein? Kit Advantages • Explore biophotonics • Study protein structure/function • Learn and apply Beer’s law • Learn spectrophotometry • Construct and use standard curves • Measure protein concentrations • Sufficient materials for 80 student work stations (4 students per station)
Workshop Time Line • Introduction • Review of the Bradford Test • Prepare Protein Standards and Samples • Measuring Absorbance and Generate a Standard Curve • Determine Protein Concentrations of Unknowns • Laboratory Extensions
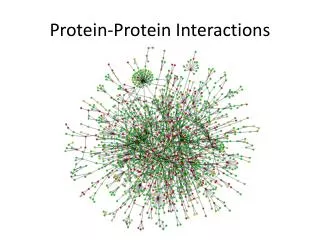
Why measure protein concentration? • First step of research protocols for chromatography, electrophoresis, western blotting • Sample quantitation • Forensics • Toxicology • Allergens • Pharmacology • Food
Bradford Assay • Uses Coomassie Blue dye which binds to the side chains of specific amino acids • Shifts the absorbance from 470nm (reddish-brown) to 595nm (blue) • Intensity of blue correlates with concentration of protein, measure: • Qualitatively by eye • Quantitatively with a spectrophotometer
Beer’s Law A=ebc If a solute absorbs light of a particular wavelength, the absorbance is directly proportional to the concentration of that solute in solution up to a point. e- the molar absorbtivity (L mol-1 cm-1) b -the path length of the sample (usually 1cm-cuvette) C - the concentration of the compound in solution (mol L-1)
Measuring Absorbance Spectrophotometers
Make Sample Dilutions • Prepare a 1:50 dilution of the two milk samples using 1xPBS: • Sample A • Sample B
Add Coomassie Dye Label cuvettes (in mg/ml): blank 1x PBS 1 0.125 2 0.250 3 0.500 4 0.750 5 1.000 6 1.500 7 2.000 A Sample A B Sample B • Add 1 ml of coomassie dye to each cuvette • Using a fresh tip for each sample, pipet • 20 µl of each standard into the appropriate cuvette (20 µl of 1xPBS for “blank”). Then pipet 20 µl of each diluted milk sample into the appropriate cuvette. • Cover each cuvette with parafilm and invert each 3x to mix. • Incubate at room temperature for a period of at least 5 minutes (but not to exceed 60 minutes).
Qualitative Determination of Protein Concentrations • Visually compare the color of the unknown samples (A and B) against the standards of known concentration.
Quantitative Determination of Protein Concentrations Read Samples Analyze Results • Read the A595 for each standard and generate a standard curve with the data • Determine the protein concentrations of Sample A and B from the standard curve
Bradford Assay Limitations • The assay measures total protein concentration, different methods must be used to identify specific proteins. • Assay is linear over a limited range • The coomassie dye binds specifically to arginine and hydrophobic amino acids. • The amino acid composition can alter the concentration-absorbance curve. Use of a standard (like BSA-Bovine Serum Albumin) with a similar composition must be used.
Proteins found in milkGot Protein? • Major proteins unique to milk are: • - Caseins • - Whey proteins • Caseins are important for the growth and development of the nursing young • The major whey proteins in cow milk are b-lactoglobulin and a-lactalbumin which is important for lactose synthesis • Other proteins found in milk are: • - Immunoglobulins (antibodies) • - serum albumin • - enzymes • - growth factors • - nutrient transporters
Laboratory Extensions • Determine the protein concentration of other samples: • - Different types of milk • - Saliva • - Tears • - Other food • - Egg yolks vs. egg whites • Analyze the specific protein content in the samples by performing SDS-PAGE and Western Blot • Students prepare protein standards
Prepare the Protein Standards • Construct standards or use “Quick Start” standards • Constructing dilutions of known protein standards: To make a 0.2mg/ml sample from a 2mg/ml stock solution: C1V1 = C2V2 2mg/ml (V1) = 0.2mg/ml (1ml) V1 = 0.2mg/ml (1ml) 2mg/ml V1 = 0.1ml Need 0.1ml of the 2mg/ml stock solution (0.9ml of 1xPBS) to make a 0.2mg/ml sample • M1V1 = M2V2 • or • C1V1 = C2V2