Download
1 / 48
480 likes | 623 Views
ARV THERAPY IN 2009: Successes and Challenges. 5 th IAS CONFERENCE ON PATHOGENESIS, TREATMENT AND BIOMEDICAL PREVENTION CAPE TOWN, 2009. Pedro Cahn. Quarraisha Abdool-Karim Andrew Beelen Andrew Cheng Andrew Clark Alexandra Calmy Joe Eron Nathan Ford Jose Gattell Diana Gibb

E N D
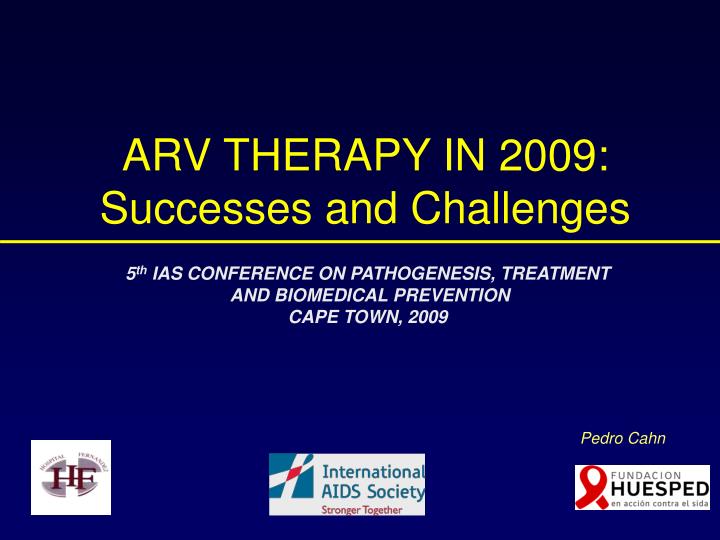
ARV THERAPY IN 2009:Successes and Challenges 5th IAS CONFERENCE ON PATHOGENESIS, TREATMENT AND BIOMEDICAL PREVENTION CAPE TOWN, 2009 Pedro Cahn
Quarraisha Abdool-Karim Andrew Beelen Andrew Cheng Andrew Clark Alexandra Calmy Joe Eron Nathan Ford Jose Gattell Diana Gibb Scott Hammer Charles Hicks Martin Hirsch Jeff Jacobs Alejandro Krolewiecki Michel Kazatchkine N Kumarasamy Louise Martin-Carpenter Julio Montaner Peter Reiss Doug Richman Mauro Schechter Chip Schooley Hernan Valdez Marco Vitoria Robin Wood Bach-Yen Nguyen Patrick Yeni Thank you for your input
Successes and Challenges • At the individual level • At the Public Health level • When to start • Safety of 1st line and monitoring : Two standards of care? • New data on existing drugs and new drugs and classes, new strategies • The Public health approach in 2009
FACTS • HAART reduces VL by 6 orders of magnitude • VL reduction drives to immune recovery • Immune recovery reduces morbidity, need for hospitalization and mortality due to AIDS • HAART impacts on “non-AIDS”associated mortality • HAART save lives, with impact at individual and population level • HAART impacts on vertical and sexual transmission • Mathematical models show possibility of dramatic reduction on incidence, driving to potential control of the epidemic
ARGENTINA:AIDS INCIDENCE RATE per million Causes of Death According to Death Certificates, Brazil 1999-2004 Pacheco, 2008
Survival 0.95 0.94 0.55 0.92 0.90 0.18 164 events LCM: 2.2/100 PY 0.90 0.87 0.08 1.0 CDM: 2.9/100 PY 218 events 0.8 0.6 Proportion alive 0.4 Entebbe Cohort(Uganda): pre-ART 1996-2000, median CD4 75 at enrolment: 57.7/100 PY 0.2 0.0 0 1 2 3 4 5 Years from enrolment About 26 fold reduction in mortality
Cumulative mortality estimates1 Calculated using extended Kaplan-Meier survival estimates 0.20 0.15 CD4+ >500 & defer ART(n=6,539) 0.10 0.05 CD4+ >500 & initiate ART(n=2,616) 0 0 2 4 6 8 10 Years after 1996 Mortality hazard ratios, adjusted for lead times and unseen events2 4 2 Mortality hazard ratio 1 0.5 500 400 300 200 100 0 CD4+ threshold (cells/mm3) When to start ART NA cohort1 • In theoretical model, deferred ART and older age (per 10 years) 60% higher risk of all-cause mortality • History of IDU and HCV were independent risk factors for mortality ART cohort collaboration2 • Delaying ART in patients with CD4+ <250 cells/mm3 and <350 cells/mm3 associated with risk of AIDS and death • For CD4+ ≥350 cells/mm3, differences in absolute risks were small 1. Kitahata M, et al. 16th CROI, Montreal 2009, #71; 2. Sterne J, et al. ibid, #72LB
Risk of opportunistic disease or death by latest CD4 count (ESPRIT/SILCAAT pooled data) * Per 100 person-years Babiker: 5th IAS
CIPRA HT 001 “… the DSMB found overwhelming evidence that starting ART at CD4 counts between 200-350 cells/mm3 improves survival compared with deferring treatment until CD4 cells drop <200 cells/mm3.Mortality in the standard-of-care group was four times higher. Among participants without baseline TB infection, twice as much developed TB in the deferred group. Many resource-limited countries have standards for HIV treatment similar to Haiti so the results of could be applicable elsewhere.” Pape J: Unpublished data, reported by NIAID, June 8, 2009
Mortality During First Year of HAART in Latin America & Caribbean (CCASANet) Death rates vary widely among Latin American, Caribbean countries Probability of death higher in Haiti, Honduras, and Peru* 0.14 Haiti (n = 1672) 0.12 Honduras (n = 329) 0.10 Peru (n = 873) Overall (n = 5152) 0.08 Chile (n = 547) Probability of Death 0.06 Brazil (n = 522) Mexico (n = 416) 0.04 Argentina (n = 794) 0.02 0.00 0 3 6 12 9 Months *Adjusting for BL CD4+ cell count at HAART initiation decreased probability of death, but rate remained higher in Haiti and Honduras. Tuboi SH: J Acquir Immune Defic Syndr. 2009 May 6
Initiation of HAART at Higher CD4 Cell Counts Is Associated With a Lower Frequency of Antiretroviral Drug Resistance Mutations at Virologic Failure Uy: J Acquir Immune Defic Syndr , 2009;51:450–453
Goals of HAART: A story of three eras • 1996-2001: To reduce the incidence of opportunistic infections and AIDS-related deaths by stopping and reversing immunologic failure • 2002-2007: To avoid emergence of resistance mutations by keeping viral load below 50 copies/mL at all stages • 2008-…..: To reduce non-AIDS morbidity and mortality and HIV transmission
FACTS ON ARV ROLLOUT • About 4 million people on ART • About 6 million still in need (with current WHO guidelines) • Western guidelines call for earlier start • Current guidelines for LMIC still calling for relatively late start. Last update circa 3 years ago.
HIV Testing Rates and Outcomes in a South African Community, 2001–2006: Implications for Expanded Screening Policies * *Eligibility by current guidelines April M: J Acquir Immune Defic Syndr 2009;51:310–316
Limitations and obstacles: Lost to follow-up • Over 20% LTFU in LMIC1 • Main reasons: Advanced disease and payment for services2 • Poverty and logistics3 : ART interruption driven by stock shortages (OR 3.25), binge drinking (2.87), slimming symptoms (1.23). Conclusion: “Food supply programs and minimization of ARV shortage may reduce ART interruptions” • Hidden costs in health care delivery might jeopardize success of “free services”4 Over 50% of the delivery costs in rural Tanzania was for transport. 1 Bull World Health Organ 2008 2. Morris K:www.thelancet.com/infection; 2008 3. Marcellin F: Tropical Medicine and Int. Health, 2008 4. Kruk M: Tropical Medicine and Int. Health, 2008
Challenges: The need for a safer start d4T based regimens: Issues with toxicity, and lipoatrophy affect adherence and discourages naïve patients to enter treatment programs Updated guidelines will recommend earlier start, Nevirapine may not be safe with higher CD4 counts d4T may select K65R in Clade C viruses
URF 4.2% A 12% AE 3.1% AG 6.7% G 5% B 10% D3.6% Global distribution of HIV-1 subtypes 2 million 1.3 million 4.8 million
Rapid Selection of K65R Resistance in Subtype C Isolates Courtesy M. Wainberg Only the subtype C sequence triggers a pausing site that increases the probability of a nucleotide misincorporation event which in turn leads to the K65R mutation.
Resistance Patterns (94 samples, patients failing d4T/3TC/NVP (1/3 switched to ZDV due to toxicity) Hosseinipour : XVII IAC Abstract TUAB0105
OPTIMIZATION: The need for monitoring • Poor coverage of 2nd line ART in LIC • Misclassification of ART failure by clinical and CD4 criteria can be as high as 45%1 resulting in unnecessary switch of ART • Prolonged treatment with a failing regimen has consequences on future drug choice and efficacy • A feasible strategy is needed to avoid loosing the benefits of the “first wave” of ARV rollout 1: Hosseinipour M: 4th IAS, Sydney, 2007
138 patients genotyped at treatment failure (WHO criteria) “Overall > 50% have multiple treatment-limiting mutations” Kantor R: Kumarasamy N: 3TC resistance: 80.5% vs 40.3% (p<0・001); at least one TAM: 27.8% and 12.1%, “Lack of viral monitoring associated with resistance in the vast majority of those with viral failure after the 1st year of HAART”. N: 149 patients, 58% misclassified. “Immunological monitoring would lead to a premature switch to 2nd line regimens” Kantor R: Kantor R:
Uncontrolled Viral Replication as a Risk Factor for Non-AIDS Severe Clinical Events in HIV-Infected Patients on Long-Term Antiretroviral Therapy: APROCO/COPILOTE (ANRS CO8) Cohort Study Age > 60 years, a low CD4 cell count, and a moderate level of HIV replication were independently associated with the occurrence of non-AIDS events during the prolonged follow-up. “Our results…underline the need to avoid virological rebound…particularly in older patients and/or those with a low CD4 cell count” Ferry T: J Acquir Immune Defic Syndr 2009;51:407–415
Monitoring HIV Antiretroviral Therapy in Resource-Limited Settings: Time to Avoid Costly Outcomes “Viral load testing needs to be introduced with the same sense of urgency and commitment as the world approached ART access. To do less is to abandon ART to an early collapse” Editorial by Sawe and McIntyre; CID 2009:49
Strategic use of viral load: Expected benefits • Improve outcomes • Protect 1st and 2nd -line regimens by avoiding unnecessary switches • Delay initiation of 2nd line ART • Resolve discordant cases of clinical and/or immunological failure • Improve and monitor adherence • Reduce resistance risk • Reduce MTCT identifying viral failures UNITAID Expert Consensus, 2009
Good news with good old drugs at IAS 2009 • DART: Triple nucleoside (ZDV/3TC/ABC) not inferior to ZDV/3TC/NVP regarding AIDS/death after 5 years1 • STAR and Stella cohorts: No difference in virologic response in naïve patients (TDF/FTC vs ABC/3TC)2 • RECOMB: Switching from ZDV/3TC to TDF/FTC significantly improves limb fat3 • HEAT:Similar VL slopes for TDF and ABC4 5th IAS- 1:Walker; 2: Koegl; 3: Ribera; 4: Yau
Good news with good old drugs at IAS 2009 • Swiss cohort: EFV based HAART lower risk of virological failure compared to LPV/r1 • German Truvada Cohort (n 523) 2: EFV advantage, OR: 2.142 • CASTLE: ATV/r non-inferior to LPV/r in naives at 96 weeks3 • M06-802: LPV/r QD non inferior to BID in experienced px4 • ARTEN:Nevirapine non inferior to ATV/r, better lipid profile, more discontinuations5 1: Bucher; 2: Zoufaly; 3: Uy 4: Badai-Faesen; 5: Soriano
NRTI & RTV sparing regimen in naïve patients Raltegravir - Atazanavir (BMS, N = 90) NRTI sparing in naïve patients Raltegravir - Lopinavir/r (Abbott P092, N = 200: 8 wk interim data - BHIVA-Apr09) Raltegravir - darunavir/rtv (ACTG 5262, N = 111) Raltegravir - darunavir/rtv (NEAT study, N = 800) Vicriviroc-Atazanavir/r (N:215) New Treatment Paradigms: Drug sparing (Selected studies)
New Treatment Paradigms: Drug sparing (Selected studies) NRTI sparing in patients with NNRTI / 1st ART failure: Raltegravir – Lopinavir/r (Collaborative study, N = 540) Raltegravir – Lopinavir/r (MRC - 3 arms, 2nd step exploring LPV/r monotherapy maintenance: N = 1000) NRTI sparing salvage regimen 1. Trio trial (ANRS): Darunavir-Etravirine-Raltegravir 2. NIAID Optimization Trial (N:577) 3. Maraviroc –Raltegravir – Darunavir (F. Huesped pilot study, N: 60)
NRTI-Sparing strategy: Proportion of subjects with HIV-1 RNA <40 copies/mL (observed data analysis) Podsadecki :15th BHIVA, 2009 Poster #P31 a-comparison between treatment groups based on Fisher’s exact test
Trying to make it simple in Cape town… • ANRS 136: Maintenance with DRV/r monotherapy vs ongoing 2 NRTIs + DRV/r: 87.5 vs 92%; 3 vs 1 SAE1 • MONET: DRV/r monotherapy 1% difference vs. triple combo2 • ARIES: ATV/r+ ABC/3TC, rtv discontinued at week 36 vs ongoing regimen: 86 vs 81% < 50 copies3 1: Katlama WBLB 102; 2Arribas :TUABLB 106; 3:Squires: WBLB 103
Integrase inhibitors: Good news in the new class • Raltegravir in naïve - 004: (n: 198) VL < 50 copies 78% vs 76% EFV; less AEs 54 vs 76%1 • Switch to RAL impacts on CD4 count: (n: 51) RAL + 119 cells vs. ongoing regimen + 39 cells2 • EASIER: Switch T-20 to RAL (n:170) Non inferior, no difference in CD4 recovery • ACTG 5244: Intensification: (n:53) No difference on VL, cross-over design. Trend towards > CD4 increase with RAL • Elvitegravir: High trough concentrations maintained w/ GS-9350 150 mg, with low within-subject variability. QUAD tablet in clinical trials 5th IAS-1: Gottuzzo 5th IAS – 2: Garrido 3: De Castro – 4: Gandhi
S/GSK1349572: The new kid on the block Dosing period Follow-up period 0.5 0.0 -0.5 -1.0 Mean Change from Baseline in HIV-1 RNA (log10 copies/mL) -1.5 -2.0 2 mg 10 mg -2.5 50 mg PBO 1(BL) 2 3 4 7 8 9 10 11 14 21(FU) Day Well tolerated, QD, linear PK/PD. Mean decrease on Day 11 in pVL of 1.51 to 2.46 log10copies/mL was observed across doses tested (2mg - 50mg)5
Newer ART Agents: The pipeline is still active (partial list)
LERSIVIRINE ( A5271010) : Mean Reduction in Viral Load over Time (Monotherapy) Last dayof dosing 0.5 0.0 Placebo 10mg BID -0.5 HIV-1 RNA change from baseline (log10 copies/mL) 30mg BID 100mg BID -1.0 500mg BID 100mg QD 500mg QD -1.5 750mg QD -2.0 0 5 10 15 20 25 28 • In vitro activity against clinically significant NNRTI mutations: K103N, Y181C/I & G190A/S • DDI profile: can be co-administered with antacids, PPIs, H2 blockers, atazanavir, darunavir, raltegravir, maraviroc, NRTIs Day Pfizer Confidential
SUCCESSES (Individual level) • Remarkable reversal of morbidity & mortality • Capacity to resume a normal life for decades, with near normal QOL. • Steady improvement on quantity and quality of drugs • Capacity to suppress viral replication even in front of drug resistance • Impact on MTCT
CHALLENGES (Individual level) • Optimizing ARV in ageing population with increasing comorbidities • Keeping drug development active and robust, to identify better long-term tolerated, user friendly and forgiving regimens to foster adherence • Managing long term toxicity • Pediatric formulations
SUCCESSES (Public health level) • 1st disease in history producing mobilization in an effort to treat people, defeating the “too complex-too costly” paradigm • From policy to programmatic roll-out: From 0% to almost 40% coverage in about 7 years, • Partnership between scientists, activists and policy makers • Putting human rights at the forefront, inclusion of marginalized groups • Increasing evidence of role of ART as prevention
Number of People Receiving ARV in Low and Middle-Income Countries, 2002-2008 > 6 million still excluded… At the end of 2008 3.8-4.3 million on ART 1 1: Souteyrand: IAS 2009 – WELBD 105
Challenges to the Public Health Approach in 2009 • Expand testing and start ARV timely, with safer regimens • Reduce high pre treatment and early on treatment mortality • Identify cheap monitoring and adherence support tools, as well as strategies to confront loss to follow up • Identify simple, low-cost 2nd and 3rd line strategies • Integrate treatment and prevention • Train and retain HCW • Integrate HIV services to scale up to better health care • Context: donor fatigue, competing priorities, global crisis
CONCLUSIONS • HAART works both at the individual and the Public health level • By reducing morbidity, mortality and transmission the concept of ART as prevention has to be redefined as HAART is prevention, of avoidable disease, deaths and new infections • To make it happen we need to reach our patients timely, retain them in the health care system, which needs to be strengthened not against HIV programs, but in synergy with it.
Known G8 HIV commitments 2008-2010 compared with “fair share” commitments as a proportion of world GDP (in millions) given US$ 61 billion needs • Figures are mostly based on the Toyako Framework for Health Report of the Health Experts Group Annex. Note that due to different methodologies for reporting HIV contributions and their focus on health systems strengthening, the United Kingdom figure is the specific amount earmarked for the Global Fund for 2008 to 2010, and figure for Germany is an estimate based on funds intended for the Global Fund and 2007 HIV funding levels. • *Global GDP proportions are based on International Monetary Fund values for 2007 Economy is in recession, HIV is not!