Download
1 / 38
380 likes | 561 Views
Hurst-Euless-Bedford ISD Texas Academic Performance Report Annual Report in c o m p l i a n ce wi t h T e x as E d u c a t ion Co d e § 3 9 . 0 5 3 February 24, 2014.

E N D
Hurst-Euless-Bedford ISDTexas Academic Performance ReportAnnual ReportincompliancewithTexasEducationCode§39.053February 24, 2014
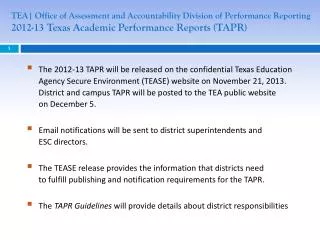
Due to changes in legislation, the performance report formerly known as the Academic Excellence Indicator System (AEIS) report is now the Texas Academic Performance Report (TAPR). • The TAPR provides information on the performance of students in each school and district in Texas. The reports also provide extensive information on school and district staff, programs, and student demographics. TAPR Overview
Campus Performance Objectives • Report on Violent or Criminal Incidents • Student Enrollment and Academic Performance • Public Hearing • Disseminating the TAPR Report • School Report Cards (SRC) • PEIMS Financial Standard Report TAPR Requirements
STAAR Proficiency and STAAR Progress Measures results are shown • Inclusion of two new postsecondary indicators • Replacement of financial profile section with direct HTML link to 2011-12 Financial Actual Report Differences from AEIS Reports
2013 TAPR ContentDistrict and Campus Performance • STAAR Performance at Phase-in Level II or above • Disaggregated by grade level, subject, and student group • Aggregated by passing standard and progress measure • Progress of Prior Year Failures (STAAR and TAKS) • TAKS Exit-Level Cumulative Pass Rate • Student Success Initiative • Grade 5 and 8 Reading • Grade 5 and 8 Math
2013 TAPR ContentDistrict (Only) Performance • Bilingual Education/English as a Second Language • STAAR Performance at Phase-in Level II or above • Disaggregated by subject, bilingual program model, ESL program model, and Limited English Proficiency (LEP) service indicator • Progress of Prior Year Failures (STAAR and TAKS) • Student Success Initiative • Grade 5 and 8 Reading • Grade 5 and 8 Math
2013 TAPR ContentDistrict/Campus Performance • STAAR Participation Rates • Attendance Rates • Annual Dropout Rates • Graduation Rates
2013 TAPR ContentDistrict/Campus Performance • College Readiness Indicators • RHSP/DAP Graduates • Advanced Course/Dual Enrollment Completion • Texas Success Initiative (TSI) – Higher Education Readiness (ELA and Math) • College-Ready Graduates (ELA, Math, and Both Subjects) • AP/IB Results • SAT/ACT Results • Graduates Enrolled in Texas Institution of Higher Learning (IHE) • Graduates in Texas IHE Completing One Year Without Remediation
2013 TAPR Report OverviewDistrict/Campus Profile • Student Information • Demographics, Graduates, Retention Rates, Class Size • Staff Information • Demographics, Experience, Salary Information • Programs • Student Enrollment, Teachers by Program • Budget • Link to Actual Financial Data report • Same as Audit Data
2013 STAAR Performance End-of-Course:English Language Arts - Reading
2013 STAAR Performance End-of-Course:English Language Arts - Writing
STAAR Percent at Phase-in 1 Level II or Above All Grades, All Subjects
STAAR Percent at Phase-in 1 Level II or Above All Grades, Reading
STAAR Percent at Phase-in 1 Level II or Above All Grades, Math
STAAR Percent at Phase-in 1 Level II or Above All Grades, Writing
STAAR Percent at Phase-in 1 Level II or Above All Grades, Science
STAAR Percent at Phase-in 1 Level II or Above All Grades, Social Studies
STAAR Final Level II or Above • All Grades, All Subjects
STAAR Percent Met or Exceeded Progress • All Grades, Reading
STAAR Percent Met or Exceeded Progress • All Grades, Math
STAAR Percent Met or Exceeded Progress • All Grades, Writing
Attendance • Class of 2012
4-Year Longitudinal Graduation Rate • (Grades 9-12)Class of 2012
5-Year Extended Longitudinal Graduation Rate • (Grades 9-12)Class of 2011
College Ready Graduates • Class of 2012
Violent and Criminal Incidents • Texas statute (TEC 39.053) requires every district to publish an annual report on violent and criminal incidents at campuses in the district • Murder, Capital Murder, etc. 0 • Possession of Prohibited Weapon 5 • Possession of Firearm 1 • Indecency With a Child 0 • Aggravated Kidnapping 0 • Aggravated Assault/Student 0 • Aggravated Assault/Teacher 0 • Sexual Assault 0 • Retaliation Against Employee 0 • Assault of Employee/Teacher 4
For more information contact: Lydia Scozzari Deputy Superintendent – Educational Operations LydiaScozzari@hebisd.edu


![Texas Academic Performance Report (TAPR) 2017-2018 [ insert district name]](https://cdn4.slideserve.com/811019/texas-academic-performance-report-tapr-2017-2018-insert-district-name-dt.jpg)