Download
1 / 13
130 likes | 256 Views
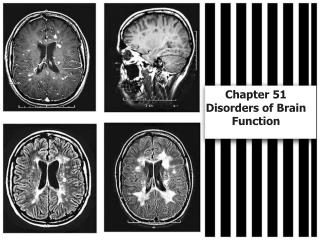
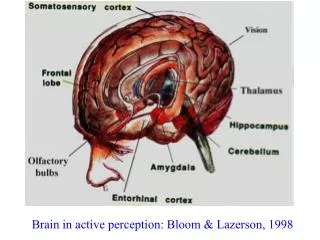
Brain in active perception: Bloom & Lazerson, 1998. Scalp EEG. Blink artifact. Structural MRI with 64 electrodes. WJF courtesy of Jeff Duyn at NIH and Thomas Witzel at MIT. Scalp recording with high density linear array. Extracranial arrays.

E N D
Scalp EEG Blink artifact
Structural MRI with 64 electrodes WJF courtesy of Jeff Duyn at NIH and Thomas Witzel at MIT
Scalp recording with high density linear array Extracranial arrays This photographic montage shows the pial surface of my ‘brain in a vat’, projected to the scalp. Gyri are light, sulci dark. EEG were from 64 electrodes. From Freeman et al. 2003 Walter J Freeman University of California at Berkeley
Electrode arrays on rabbit brain Diameter: modal 15 mm, 95% inclusion 28 mm Left hemisphere of the rabbit brain with size and locations of 8x8 electrode arrays: rectangles 6x6 mm, spacing 0.8 mm. The circles show typical sizes of activity domains.
8x8 recording in waking rabbit EEG from 8x8 pial array, rabbit auditory cortex. Spacing: 0.79 mm 1st component PCA: 94% Digitizing step: 2 ms Nyquist frequency: 250 Hz Walter J Freeman University of California at Berkeley
Difference of scale is 33:1 Scale-free CAPD
Acknowledgements Acknowledgments This work was supported by grants from NIMH (MH-06686), ONR (N00014-93-1-09380, and NSF (EIA-0130352). Human EEG and EMG data were collected and edited by Mark D. Holmes and Sampsa Vanhatalo in the EEG Clinic, Harborview Hospital, University of Washington, Seattle, and analyzed in the Dep’t of Molecular & Cell Biology in the University of California at Berkeley. Data processing and programming were by Linda Rogers and Brian Burke. The animal data were collected in collaboration with John Barrie, Mark Lenhart, and Gyöngyi Gaál.