Download
1 / 18
200 likes | 332 Views
A SIMPLE NUMERICAL DERIVATION OF THE BOLTZMANN DISTRIBUTION John A. Varriano Christian Brothers University PHYS 353 Solid State Physics. What is an energy distribution?. Suppose you have a population of objects. What is the probability that an object has a certain energy E ?.

E N D
A SIMPLE NUMERICAL DERIVATION OF THE BOLTZMANN DISTRIBUTION John A. Varriano Christian Brothers University PHYS 353 Solid State Physics
What is an energy distribution? Suppose you have a population of objects. What is the probability that an object has a certain energy E? This probability is given by the energy distributionP(E).
Discrete: Probability that an object has an energy between E1 and E2 Quiz! Continuous: Probability that an object has an energy between E1 and E2 Quiz! What is an energy distribution? 1 1
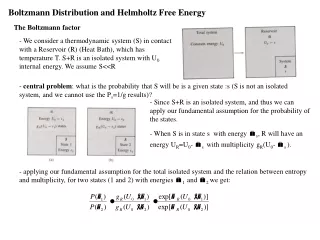
C = normalization constant The Boltzmann Energy Distribution Eo = average energy of an object
Where do you see it used? Ideal Gas Law
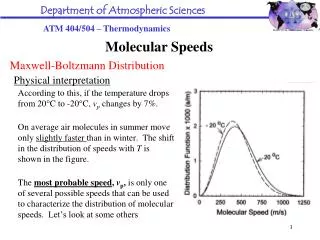
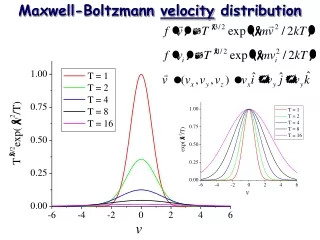
Where do you see it used? Thermal Radiation (Blackbody Radiation)
Where do you see it used? Operation of a Diode
So where does it come from? Okay, here comes the “simple” numerical derivation! Quantum Physics of Atoms, Molecules, Solids, Nuclei, and Particles (2nd ed.), Eisberg & Resnick (Wiley & Sons, 1985). Appendix C.
Consider a simple closed system that has four entities (atoms, molecules, springs, balls). The entities are able to interact with each other and exchange energy. Suppose each entity can only have an energy of E = 0, DE, 2DE, 3DE Suppose the total energy of the system is Etot = 3DE. Questions: 1. How many distinguishable, different ways can the total energy be divided among the four entities? 2. What are the probable number of entities with a given energy E?[ n(E) ] 3. What is the probability that a particular entity has an energy E? [ P(E)]
DE 2DE 3DE 4DE 0 No. of entities with energy E 12 0 0 4 0 Number of distinguishable divisions = 4 Scenario 1 : 3 entities with E = 0 ; 1 entity with E = 3DE
DE 2DE 3DE 4DE DE 2DE 3DE 4DE 0 0 No. of entities with energy E 12 6 6 0 0 12 6 6 0 0 Number of distinguishable divisions = 12 Scenario 2 : 2 entities with E = 0 ; 1 entity with E = DE; 1 entity with E = 2DE
DE 2DE 3DE 4DE 0 No. of entities with energy E 4 12 0 0 0 Number of distinguishable divisions = 4 Scenario 3 : 1 entity with E = 0 ; 3 entities with E = DE
20 Question: 1. How many distinguishable ways can the total energy be divided among the four entities? We assume that all possible energy divisions of the system occur with the same probability. (Each of the 20 possibilities has an equal chance of occurring.) The probability for each division is then 1/20. The probability that Scenario 1 occurs would then be 4/20. The probability of Scenario 2 occurring is 12/20 and the probability of Scenario 3 is 4/20. Note that Scenario 2 is more likely simply because there are more divisions possible which leave the system in this scenario.
Energy No. of entities with energy E n(E) Note that summing up n(E) over all possible energies gives 4, the total number of entities in the system. 0 40 40/20 = 2.0 DE 24 24/20 = 1.2 2DE 12 12/20 = 0.6 3DE 4 4/20 = 0.2 4DE 0 0/20 = 0 Question: 2. What are the probable number of entities with a given energy E?[ n(E) ] We can figure this out two ways: Method 1: Add up the number of entities with energy E for all of the 20 possible different divisions. Divide this number by 20 to get the average number of entities with an energy of E.
Scen. 1 Scen. 2 Scen. 3 Probability of scenario occurring 4/20 12/20 4/20 No. of entities with energy E Energy Scen. 1 Scen. 2 Scen. 3 n(E) 0 3 2 1 3(4/20) + 2(12/20) + 1(4/20) = 2.0 DE 0 1 3 0(4/20) + 1(12/20) + 3(4/20) = 1.2 2DE 0 1 0 0(4/20) + 1(12/20) + 0(4/20) = 0.6 3DE 1 0 0 1(4/20) + 0(12/20) + 0(4/20) = 0.2 4DE 0 0 0 0(4/20) + 0(12/20) + 0(4/20) = 0 Method 2: For each of the 3 possible scenarios, multiply the number of entities with the same energy E by the probability of that scenario occurring. For each energy, there will be 3 products. The sum of these 3 products will be the probable number of entities with energy E.
Energy n(E) P(E) 0 2.0 2.0/4 = 0.50 DE 1.2 1.2/4 = 0.30 Note that summing up P(E) over all possible energies gives 1. That is, the probability that an entity has an energy between 0 and the total energy is 100%. 2DE 0.6 0.6/4 = 0.15 3DE 0.2 0.2/4 = 0.05 4DE 0 0/4 = 0 Questions: 3. What is the probability that a particular entity has an energy E? [ P(E)] This probability is proportional to n(E). Since n(E) is the probable number of entities with energy E, we simply divide this number by the total number of entities in the system (4 in this case) to obtain P(E).
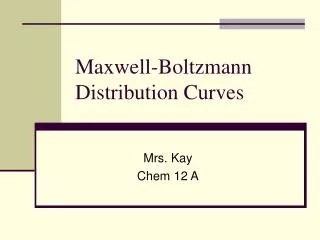
C = 0.573 Eo = 1.32 Below we plot the probabilities that an entity has energy E versus E with blue data points. The red curve is the function P(E) = C e-E/Eowhere C and Eo have been chosen to give the best fit.
Now imagine that: • keep total energy the same (same Etot) • keep the number of entities the same (4) • divide Etotinto smaller divisons(DE0) so more energies available Result: We get more data points and they fall closer to the exponential curve. Finally, imagine that we let the number of entities to be large. Result: The data points form the exponential curve of the Boltzmann distribution!