Download
1 / 5
50 likes | 160 Views
27 th May 2013. STRONG BUY. CEAT Ltd. TARGET Rs. 150 . This Tyre takes you to a million places. Investment rationale

E N D
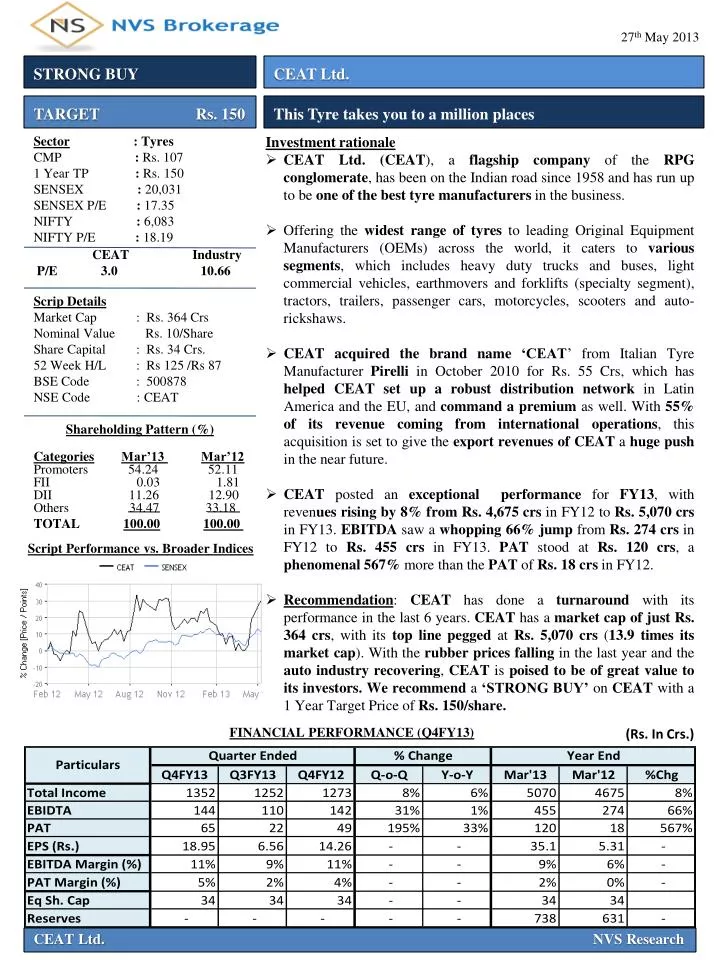
27thMay 2013 STRONG BUY CEAT Ltd. TARGET Rs. 150 This Tyre takes you to a million places • Investment rationale • CEAT Ltd. (CEAT), a flagship company of the RPG conglomerate, has been on the Indian road since 1958 and has run up to be one of the best tyre manufacturers in the business. • Offering the widest range of tyresto leading Original Equipment Manufacturers (OEMs) across the world, it caters to various segments, which includes heavy duty trucks and buses, light commercial vehicles, earthmovers and forklifts (specialty segment), tractors, trailers, passenger cars, motorcycles, scooters and auto-rickshaws. • CEATacquired the brand name ‘CEAT’ from Italian Tyre Manufacturer Pirelli in October 2010 for Rs. 55 Crs, which hashelped CEAT set up a robust distribution network in Latin America and the EU, and command a premium as well. With 55% of its revenue coming from international operations, this acquisition is set to give the export revenues of CEAT a huge push in the near future. • CEAT posted an exceptional performance for FY13, with revenues rising by 8% from Rs. 4,675 crsin FY12 to Rs. 5,070 crsin FY13. EBITDA saw a whopping 66% jump from Rs. 274 crsin FY12 to Rs. 455 crs in FY13. PAT stood at Rs. 120 crs, a phenomenal 567% more than the PAT of Rs. 18 crsin FY12. • Recommendation: CEAThas done a turnaround with its performance in the last 6 years. CEAT has a market cap of just Rs. 364 crs, with its top line pegged at Rs. 5,070 crs(13.9 times its market cap). With the rubber prices falling in the last year and the auto industry recovering, CEAT is poised to be of great value to its investors. We recommend a ‘STRONG BUY’ on CEAT with a1 Year Target Price of Rs. 150/share. Sector: Tyres CMP : Rs. 107 1 Year TP : Rs. 150 SENSEX :20,031 SENSEX P/E:17.35 NIFTY: 6,083 NIFTY P/E : 18.19 CEAT Industry P/E3.0 10.66 Scrip Details Market Cap : Rs. 364Crs Nominal Value Rs. 10/Share Share Capital : Rs. 34Crs. 52 Week H/L : Rs 125 /Rs 87 BSE Code : 500878 NSE Code : CEAT Shareholding Pattern (%) CategoriesMar’13 Mar’12 Promoters 54.24 52.11 FII 0.03 1.81 DII 11.26 12.90 Others 34.47 33.18 TOTAL 100.00100.00 Script Performance vs. Broader Indices FINANCIAL PERFORMANCE (Q4FY13) (Rs. In Crs.) CEAT Ltd.NVS Research
CEAT – Company Profile • CEAT, a flagship company of the RPG Conglomerate, was first established in 1924 at Turino in Italy and manufactured cables for telephones and railways. In 1958, CEAT came to India, and CEAT Tyres of India Ltd was established in collaboration with the TATA Group. In 1982, the RPG Group took over CEAT Tyres of India, and in 1990, renamed the company CEAT Ltd. • CEAThas captured over 12% of market share, manufacturing about 10 million tyres every year. CEATowns two bias tyres manufacturing facilities in Maharashtra (Bhandup& Nasik) and has also set up a greenfield radial tyre manufacturing facility at Gujarat (Halol). Revenue Segmentation Volume Growth • Key highlights • Robust growth in Replacement market:More than 50% of CEAT’s revenues come from the Replacement market, and the Replacement market has grown in the last year, which is expected to give a boost to the company’s future earnings. • Volume growth: CEAT has seen a volume growth of 6% on a YoY basis and an8% volume growth on a CAGR basis from FY09 to FY13. This was mainly on account of higher growth in the OEM segment and softening of the raw material prices, the combined effect of which led to an EBITDA expansion for the full year. • New Product Development:CEAT has lined up a premium range of SUV radial tyres called CZAR anda healthy pipeline of 100 plus product launches in FY14. This gives CEAT some positivity in terms of volume growth going ahead. • Capacity Expansion:The plant in Halol has also ramped up and production is at about 80% plus utilization at the close of the year. With an increased capacity, and new product ideas lined up, the future growth and revenues of CEAT look quite promising. CEAT Ltd.NVS Research
Past Years’ Financial Performance Financial performance (in Rs. Cr.) • Past Years: CEAT has seen a complete turnaround in its performance in the last 5 years, having improved its margins steadily and considerably in times of pressure. Revenues saw a robust growth of 19% on a CAGR basis from Rs. 2,558 crs in FY09 to Rs. 5,070 crs in FY13. EBITDA grew at a phenomenal 72% CAGR from Rs. 52 crs in FY09 to Rs. 455 crs in FY13. PATfluctuated between FY09 and FY13, but the company posted an impressive PAT of Rs. 120 crs in FY13, a difficult year for the industry. • FY2013 performance: In a year where the raw material prices played havoc with the industry, CEATposted an exceptional performance for FY13, with revenues rising by 8% from Rs. 4,675 crs in FY12 to Rs. 5,070 crs in FY13. With expenses remaining more or less in line with last year, EBITDAsaw a whopping 66% jump from Rs. 274 crs in FY12 to Rs. 455 crs in FY13. PAT stood at Rs. 120 crs, a phenomenal 567% more than the PAT of Rs. 18 crsin FY12. • Impact of raw material prices: Over 70% of CEAT’s cost is the cost of raw materials, of which ~43% is natural rubber. Natural Rubber prices in Indiapeaked last year in April-May and Sept-Oct 2012 to about Rs. 200/kg, which severely hit most of the industries. CEAT made a conscious effort to improve its EBITDA and PAT margins, which enabled it tomaintain its performance even in these times of pressure, . The raw material prices are falling now, and currently stand at Rs. 169/kg. These trends, backed by CEAT’sperformance in the past, augur well for the company going ahead. CEAT Ltd.NVS Research
Peer Comparison Financial performance (in Rs. Cr.) • CEAT is currently trading at a very low P/E of 3.0x, which is the lowest as compared to its peers. This indicates that CEAT has immense potential and grossly undervalued with respect to the other firms in the industry, which makes it a very attractive investment. • CEAT is trading at a P/BV of 0.5, which yet again is one of the lowest in the industry, and compared to its other peers, CEAT is relatively undervalued. • Higher PAT/MCAP ratio of CEATthan its peers indicates that the company is undervalued. CEAT’s PAT/MCAP ratio is higher at 31% when compared to the other giants like Apollo and MRF. • CEAT’s EBITDA and PAT margins are slightly on the lower side due to the fluctuating raw material pricesand subdued auto demand. However, these are on an improving trend and the fact that CEAT has shown a superb result indicates that the company can perform in times of pressure also. This is an encouraging sign for the company in the coming times. • Recommendation • Touted as one of the most reputed tyre brands in the country, CEAT has done a turnaround with its performance in the last 6 years. Armed with strong financials, CEAT has a market cap of just Rs. 364 crs, with its top line pegged at Rs. 5,070 crs(13.9 times its market cap). With the rubber prices falling in the last year and the auto industry recovering, CEAT is poisedto be of great value to its investors. We recommend a ‘STRONG BUY’ on CEAT with a 1 Year Target Price of Rs. 150/share. CEAT Ltd.NVS Research