Download
1 / 34
350 likes | 414 Views
Learn about quantitative analysis using EPMA for determining elemental compositions in Geoscience. Understand the critical factors, standards, matrix corrections, and models involved in precise chemical analysis. Explore the historical evolution and methods employed for accurate results. Gain insights into absorption effects and the importance of sample surface geometry.

E N D
UW-Madison Geoscience 777 Electron Probe MicroanalysisEPMA EDS Part 2: Quantitative Analysis Table of Elemental Composition Spectrum with X-ray Peaks Version 2/2419
EDS Spectrum Wt% Elements • EDS can easily give qualitative analysis shows which elements are present in a sample—but need to be ‘intelligent user’ and not blindly trust “Auto ID”! • But how to go from raw counts (peak channel, or integrate under the whole peak) to some highly reliable chemical analysis???
EDS Spectrum Wt% Elements • Need to use STANDARDS! • sometimes called Reference Materials • We do EPMA: Electron Probe MicroAnalysis • = Traditionally by WDS with Electron Probe, but with proper procedures, some EPMA*can be by SEM EDS * “Some” in operative word. A main goal of this class is understanding What SEM EDS EPMA is good--and is what is not.
Critical Factors for Quant Analysis All samples must be polished perfectly flat/smooth Non-conductive materials must have conductive coating Samples must be perpendicular to the electron beam
Critical Factors for Quant Analysis • Counts are acquired on BOTH unknowns and standards on the same instrument, under the same operating conditions: • -- Same positions relative to beam & detector • -- Same kV • -- Same beam current, or measured directly • Use a Faraday cup to measure beam current for all X-ray measurements
“Father of EPMA” RaimondCastaing (1921-1998) • Took a war-surplus TEM (= electron gun) and built a crystal spectrometer, added to the side • Castaing’s PhD Thesis in 1951 “Application of Electron Probes to Local Chemical and Crystallographic Analysis”
RaimondCastaing (1921-1998) His thesis laid out the basics of EPMA which have remained constant for the past 64 years Key concept: where K is the “K ratio” for element i, I is the X-ray intensity of the phase and subscript i is one element.
RaimondCastaing (1921-1998) This is a Standards-Based k-ratio analytical protocol
UW- Madison Geology 777 Castaing’s First Approximation Castaing’s “first approximation” follows this approach. The composition C of element i of the unknown is the K-ratio times the composition of the standard. In the ‘simplest’ case where pure element standards can be used, Cistd = 1 and drops out. …So how close are these K-ratios to the true composition?
Examples: First Approximation... Fo90 Olivine Hafnon HfSiO4 Notice the differences between K-ratios and true compositions….So we need a MATRIX CORRECTION Zircon ZrSiO4
UW- Madison Geology 777 This plot of Fe Ka X-ray intensity data demonstrates why we must correct for matrix effects. Here 3 Fe alloys show distinct variations. Consider the 3 alloys at 40% Fe. X-ray intensity of the Fe-Ni alloy is ~5% higher than for the Fe-Mn, and the Fe-Cr is ~5% lower than the Fe-Mn. Thus, we cannot use the raw X-ray intensity to determine the compositions of the Fe-Ni and Fe-Cr alloys. Raw data needs correction (Note the hyperbolic functionality of the upper and lower curves)
UW- Madison Geology 777 • Note that the Fe-Mn alloys plot along a 1:1 line, and so is a good reference. • The Fe-Ni alloys plot above the 1:1 line (have apparently higher Fe than they really do), because the Ni atoms present produce X-rays of 7.278 keV, which is greater than the Fe K edge of 7.111 keV. Thus, additional Fe Ka are produced by this secondary fluorescence. Absorption and Fluorescence • The Fe-Cr alloys plot below the 1:1 line (have apparently lower Fe than they really do), because the Fe atoms present produce X-rays of 6.404 keV, which is greater than the Cr K edge of 5.989 keV. Thus, Cr Ka is increased, with Fe Ka are “used up” in this secondary fluorescence process.
UW- Madison Geology 777 Matrix Corrections Critical concept: We need to CORRECT for DIFFERENCE (in electron/X-ray behavior) BETWEEN the UNKNOWN and the STANDARD being used to quantify the Unknown Four types of models used (historically) for matrix corrections in EPMA: Empirical: simplest, based on known binary experimental data; ZAF: 1st generalized algebraic procedure; assumes a linear relation between concentration and x-ray intensity; Phi-rho-Z: based upon depth profile (tracer) experiments; Monte Carlo: based upon statistical probabilities of electron-sample interactions, particularly for unusual specimen geometries.
ZAF • Z = Atomic number effects • A = Absorption effects • F = Fluorescence effects
ZAF • Z = Atomic number effects • A = Absorption effects • F = Fluorescence effects Historically, the “binary” and the “ZAF” corrections were used for the first 3-4 decades of EPMA. Phi-rho-Z: here the Z and A and merged into one correction. By the 1990s the phi-rho-Z corrections has been mainly used.
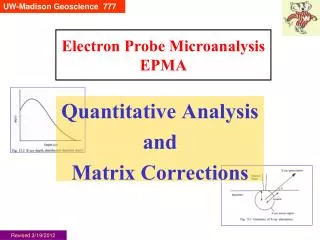
UW- Madison Geology 777 We pay some more attention to absorption: in some/many samples it can be the largest correction--especially for “light elements”. Geometry of sample surface particularly critical. Need flat so that the matrix correction can work! It assumes a flat surface, with beam at 90° to the surface. PATH LENGTH!!! Absorption Reed, 1993,, p. 219
UW- Madison Geology 777 To be able to correct for this absorption of the measured X-rays, we need to know how the production of X-rays varies with depth (Z) in the material. The distribution of X-rays generated as a function of depth is known as the f(rz) [phi-rho-z] function, where a “mass depth” parameter is used instead of simple z (bottom right). The f(rz) function is defined as the intensity generated in a thin layer at some depth z, relative to that generated in an isolated layer of the same thickness. This can then be integrated over the total depth where the incident electrons exceed the binding energy for that particular characteristic x-ray. Absorption Reed, 1993, p. 219
UW- Madison Geology 777 Iterations of Matrix Correction Start with the X-ray Intensities of EACH element i, of the unknown divided by the standard (= K-ratio) Calculate a ZAF correction for the unknown element i, using the previously (step 6) calculated compostion. If this is the first iteration, use Castaing’s First Approximation (we know the composition of the Standard, so its ZAF is easy). Multiply these 4 numbers by the Element i composition of the Standard This gives a first result for the composition of element I in the unknown. This happens at the same time for all other elements. They are summed together, and generate the input for a second iteration Repeat iterations (step 2-6) until convergence (e.g. 3-4 times usually)
UW- Madison Geology 777 This is a Standards-Based k-ratio analytical protocol Quality Control in EPMA Recall the earlier slide: Traditional WDS EPMA always used locally, contemporaneously measured standards, at the time the unknowns were measured.
UW- Madison Geology 777 Quality Control in EPMA It is very easy to “get a chemical composition” in EPMA However, it is not necessarily easy to get an accurate chemical composition in EPMA: everything has to go correctly, and one error can ruin an analysis How do we determine the “goodness of an EPMA analysis”???
UW- Madison Geology 777 Using a range of materials (metals, compounds, minerals, glasses) of independently determined chemical compositions, EPMA-determined compositions can be compared to the “accepted true” compositions. “Relative Deviation from the Expected Value” RDEV can then be determined, either as a % or decimal fraction of the expected value (around 0%, or 1.0) Quality Control in EPMA Goldstein et al, 2018, SEMXRMA, page 296
UW- Madison Geology 777 An early –1975--critical look at the “goodness” of the ZAF correction for a suite of binary metal reference materials, for traditional WDS-EPMA using explicit standards, showing 95% of the data falls in a +5 to -5% relative error range of the “true” values. Note 5% are “really” bad numbers. Quality Control in EPMA Goldstein et al, 2018, SEMXRMA, page 296
UW- Madison Geology 777 Quality Control in EPMA Two decades later, again for WDS-based EPMA: The ZAF data is not that much different from 1975, but a new matrix correction (“PAP” phi-rho-Z) has tightened the RDEV, so that ~95% of the analyses are ±2.5%(relative) of the accdepted compositions. Goldstein et al, 2018, SEMXRMA, page 296
UW- Madison Geology 777 Virtually all SEMs with EDS operate with a “Black Box” quantitative EPMA protocol, which does NOT require the operator to carefully verify that specific conditions are meet, nor requires that the somewhat time-consuming measurement of standards be undertaken, at each session. For example, nowhere is the user warned that non-flat non-polished surfaces cannot be accurately measured. Instead of the user acquiring X-ray counts on standards, the manufacturer provides a (hidden) table of reference counts on a series of (usually) metal standards (measured years before), to create K-ratios for your samples. And since the K-ratios typically would generate terrible looking totals, they are immediately (in the black box) normalized to 100 wt%, so that the user is lulled into complacency. “Standardless EPMA = SEM EDS”
UW- Madison Geology 777 Dale Newbury of NIST has written and lectured extensively about the pitfalls of “black box” EDS. Here, in 1995, he demonstrated the large errors possible with EDS “standardless” analysis, where there are huge errors possible. “Standardless EPMA = SEM EDS” Goldstein et al, 2018, SEMXRMA, page 297
UW- Madison Geology 777 Not much has changed between 1995 and 2016, says Dale Newbury. With newer detectors and thin windows, it should be possible to correctly measure materials with abundant oxygen. Here are results, both with oxygen explicitly measured and with it assumed by stoichiometry. Still significant problems. “Standardless EPMA = SEM EDS” Goldstein et al, 2018, SEMXRMA, page 297
UW- Madison Geology 777 • Here is an example of a well known material, with a SEM-EDS using explicit standards (top), compared with the results from 2 different EDS systems. • Notice • Errors in the wt (mass) fractions • Errors in the formula of the crystal “Standardless EPMA = SEM EDS” Goldstein et al, 2018, SEMXRMA, page 298
UW- Madison Geology 777 Analytical total: when all, independently matrix-corrected elements, are summed together, if this number called the analytical total is close to 100.0 wt%--without normalization, then that is evidence for a “good analysis”. Usually ranges from 98.5/99.0 to 100.5/101.0 are considered acceptable, particularly for natural materials where some trace elements are not measured. If the material is crystalline and there is a recognized stoichiometric relationship between elements or groups (on a site), then a correct stoichiometry is also considered to be evidence of a “good analysis”. Quality Control in Your EPMA Results
UW- Madison Geology 777 Quality Control in Your EPMA Results There are times when one wishes to recalculate from weight % to atomic %. Here the usual procedure is to normalize.. and magic! There is a perfect 100.0 total! This however can be dangerous if the analytical total is not around 100 wt%, and missing element/s, or “second fluoresced additional elements” can lead to significant errors of interpretation of samples. If/when one must normalize EPMA data, proper procedure is that one should also publish the analytical wt% totals. When reading a research paper, any publication showing analytical totals of exactly 100 wt% should be met with suspicion.
UW- Madison Geology 777 The matrix correction can only yield a correct composition only if ALL elements are included, which may mean elements which are difficult to measure (e.g. Li, Be, B). The software must provide some mechanism to include those elements. How to deal with OH or H2O? Of course, C and O can be measured.. Though care must be taken... All elements? Element by difference: most software lets you define such an element; the (dangerous) assumption is that the difference from 100 wt% is this element... Again, this can lead to significant errors if there is some unknown source of error in the analysis.
UW- Madison Geology 777 Standardless Analysis • Recall • “Standardless Analysis” actually does use standards... • Which were at one time “freshly” acquired... • Probably not necessarily with YOUR detector on YOUR SEM ... • At SOME “beam dose” (=beam current) – recall that the X-ray intensity is a direct function of the beam current
UW- Madison Geology 777 Standardless Analysis • So say at the EDS factory at 20 kV and a beam current of 20 nA on pure Al, they got 2000 counts on Al Ka; • You are using some unmeasured beam current and get 4000 counts of Al Ka on some alloy of Al • This is not going to be simple straight forward K-ratio math! • Lots of normalizations will have to happen. . • Who knows what errors ... recall the huge RDEV errors in the histograms Newbury showed
UW- Madison Geology 777 • So Oxford has developed an easy-to-do-better-standardless protocol: • Set up kV and beam current you will be using • On a pure metal --best is Co (Ni, or Cu are ok), for the given beam “dosage”, acquire Co X-ray counts • This then is ratioed to the Oxford factory Co X-ray counts, and this ratio then provides a measure (factor) of the beam dosage actually present on the SEM being used • Using that factor and the Oxford beam current, gives your SEM’s beam current equivalent Standardless Analysis ... with a Twist
UW- Madison Geology 777 • Now measured X –ray counts on the SEM can be compared to “black box” count rate library, normalized to the same beam current (dosage), and a K-ratio for that element generated • This K-ratio should then be close to that if there were actual current measured • We can experiment with this protocol in our lab sessions, using some materials of known compositions (measured by standards-based WDS-EPMA) Standardless Analysis ... with a Twist