Download
1 / 12
120 likes | 275 Views
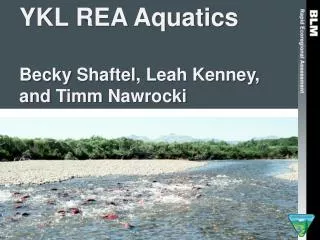
YKL REA Northern Pike Model. Photo: ADF&G. Fish Distribution Models. Process AFFID data for use in models. Classification tree and random forest models. ADF&G AFFID species occurrence data. Create stream network and landscape predictor variables in GIS. GIS source data.

E N D
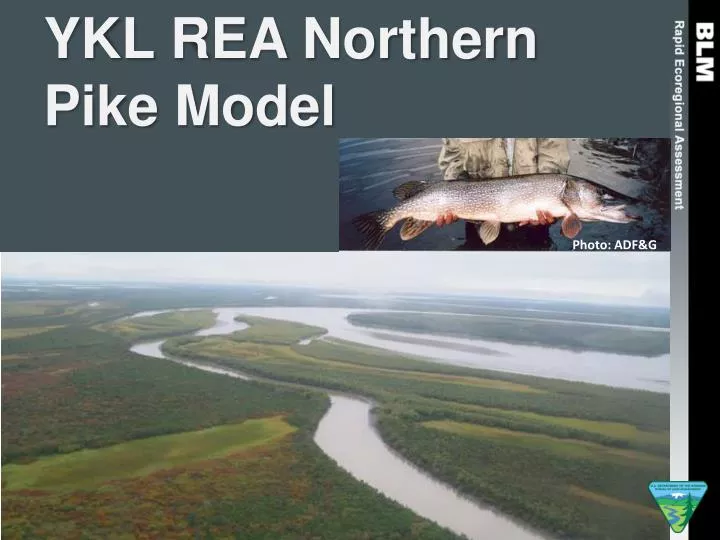
YKL REA Northern Pike Model Photo: ADF&G
Fish Distribution Models Process AFFID data for use in models Classification tree and random forest models ADF&G AFFID species occurrence data Create stream network and landscape predictor variables in GIS GIS source data Evaluate model performance Predict species habitat across REA study area Fish distributions Photo: USFWS
Stream Network • Used TauDEM to process DEM • Add in additional HUCs on boundary of study area that flow into the study area • Fill pits • Calculate flow direction (D8 method) • Calculate contributing area • Create stream network based on curvature method and drop analysis
Predictor Variables Photo: USFWS
Process AFFID data • Presences from AFFID and ADF&G/BLM telemetry project in Kuskokwim • Absences from projects in AFFID that listed fish community sampling as an objective • Resampled data in areas of high intensity (Pebble area and telemetry) • Shifted points along flow direction grid until they reached the stream network • Extracted all predictor variables to each data point
Classification Trees Asterospicularia laurae Shelf: Inner, Mid Shelf: Outer Absent 0.97 (263) Location: Back, Flank Location: Front Depth < 3m Depth ≥ 3m Absent 0.78 (64) Absent 0.56 (9) Present 0.81 (37) (De'Ath and Fabricious 2000) Classification Tree Analysis Steps: • Identify the groups • Choose the variables • Identify the split that maximizes the homogeneity of the resulting groups • Determine a stopping point for the tree • Prune the tree using cross-validation Misclassification rates: Null = 15%, Model = 9% Photo: USFWS
Random Forests • Creates many classification trees and combines predictions from all of them: • Start with bootstrapped samples of data • Observations not included are called out-of-bag (OOB) • Fit a classification tree to each bootstrap sample, for each node, use a subset of the predictor variables • Determine the predicted class for each observation based on majority vote of OOB predictions • To determine variable importance, compare misclassification rates for OOB observations using true and randomly permuted data for each predictor
Run models in R ct1<-mvpart(pres.f~.,data=fish.pred1[s1,],xv="1se") rf1<-randomForest(pres.f~.,data=fish.pred1[s1,],ntree=999) Photo: USFWS
Model Performance Photo: USFWS Top five variables are watershed area, stream order, stream elevation, percent of watershed covered by lakes, and stream floodplain.
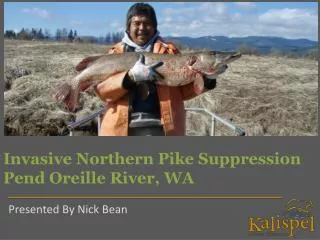
Northern Pike Results: ~ 10,900 km of predicted summer habitat (restricted to stream reaches > 1 km in length)
Increased potential for establishment of invasive macrophytes and changing fire dynamics ClimateChange Human Uses Fire Invasive Macrophytes Increased contaminant sources Mining Temperature Precipitation Infrastructure Direct destruction of habitat, hindrance of migration routes, increased downstream turbidity and sedimentation Change in deposition rates Permafrost thaw Harvest Elodeassp could reduce quality of spawning habitat In creased toxicity Temporary increases in nutrient inputs Subsistence harvest pressures on overwintering populations Expanded ice-free season Contaminants Increased winter precipitation may increase overwintering habitat Bioaccumulation of mercury in adults Increase depth of active layer will increase lake drainage area Reduction in age at maturity and shift in spawning season Permafrost Northern Pike Esoxlucius Change Agents Drivers Habitat CE General Effect CE-Specific Effect
Review • Please review and provide comments: • Distribution models for fish and habitats • Conceptual models and text descriptions for fish • Contact: Rebecca Shaftel • rsshaftel@uaa.alaska.edu, 907-786-4965 Photo: USFWS