Download
1 / 1
10 likes | 106 Views
UMW LOGO HERE. A Suitability Analysis for UMW Expansion Nathan Dawes GISc 351 Spring 2013 University of Mary Washington. Results. Introduction. Methodology.

E N D
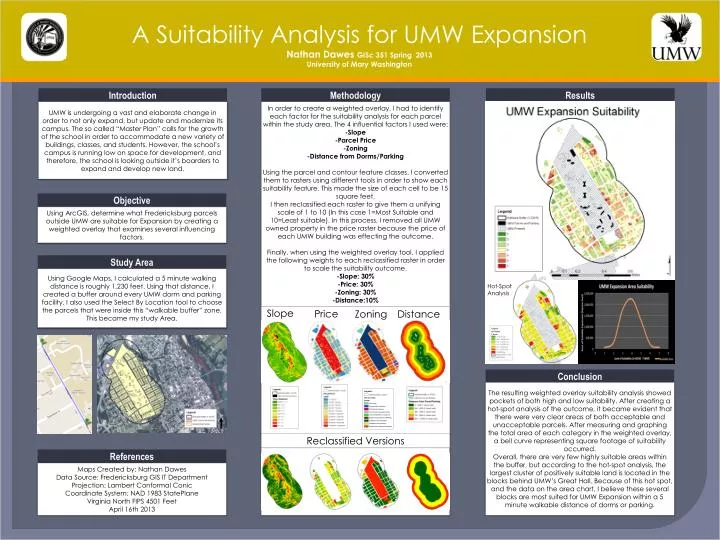
UMW LOGO HERE A Suitability Analysis for UMW Expansion Nathan Dawes GISc 351 Spring 2013 University of Mary Washington Results Introduction Methodology • In order to create a weighted overlay, I had to identify each factor for the suitability analysis for each parcel within the study area. The 4 influential factors I used were: • -Slope • -Parcel Price • -Zoning • -Distance from Dorms/Parking • Using the parcel and contour feature classes, I converted them to rasters using different tools in order to show each suitability feature. This made the size of each cell to be 15 square feet. • I then reclassified each raster to give them a unifying scale of 1 to 10 (In this case 1=Most Suitable and 10=Least suitable). In this process, I removed all UMW owned property in the price raster because the price of each UMW building was effecting the outcome. • Finally, when using the weighted overlay tool, I applied the following weights to each reclassified raster in order to scale the suitability outcome. • -Slope: 30% • -Price: 30% • -Zoning: 30% • -Distance:10% UMW is undergoing a vast and elaborate change in order to not only expand, but update and modernize its campus. The so called “Master Plan” calls for the growth of the school in order to accommodate a new variety of buildings, classes, and students. However, the school’s campus is running low on space for development, and therefore, the school is looking outside it’s boarders to expand and develop new land. Objective Using ArcGIS, determine what Fredericksburg parcels outside UMW are suitable for Expansion by creating a weighted overlay that examines several influencing factors. Study Area Using Google Maps, I calculated a 5 minute walking distance is roughly 1,230 feet. Using that distance, I created a buffer around every UMW dorm and parking facility. I also used the Select By Location tool to choose the parcels that were inside this “walkable buffer” zone. This became my study Area. Hot-Spot Analysis Slope Price Zoning Distance Conclusion The resulting weighted overlay suitability analysis showed pockets of both high and low suitability. After creating a hot-spot analysis of the outcome, it became evident that there were very clear areas of both acceptable and unacceptable parcels. After measuring and graphing the total area of each category in the weighted overlay, a bell curve representing square footage of suitability occurred. Overall, there are very few highly suitable areas within the buffer, but according to the hot-spot analysis, the largest cluster of positively suitable land is located in the blocks behind UMW’s Great Hall. Because of this hot spot, and the data on the area chart, I believe these several blocks are most suited for UMW Expansion within a 5 minute walkable distance of dorms or parking. Reclassified Versions References Maps Created by: Nathan Dawes Data Source: Fredericksburg GIS IT Department Projection: Lambert Conformal Conic Coordinate System: NAD 1983 StatePlane Virginia North FIPS 4501 Feet April 16th 2013