Download
1 / 15
160 likes | 349 Views
Power domination on probe interval graphs. Chih-Shan Liu. Outline. Introduction Domination Power domination Interval graph Probe interval graph Previous results Reference. Introduction. Domination

E N D
Power domination on probe interval graphs Chih-Shan Liu
Outline • Introduction • Domination • Power domination • Interval graph • Probe interval graph • Previous results • Reference
Introduction • Domination A subset S Vis a domination set of G if every vertex outside S has a neighbor in S, i.e., N[S]=V. a c d f g S={c,d,g} b e
Introduction • Power domination Let G = (V,E) be a graph representing an electric powersystem. A PMU measures the state variable (voltage and phase angle) for the vertex at which it is placed and its incident edges and their endvertices. (These vertices and edges are said to be observed.) We will introduce the observation rules[1] in the following. Power domination problem is to observe all the electric power system.
Introduction • Observation rules • Any vertex that is incident to an observed edge is observed.
Introduction • Observation rules • Any edge joining two observed vertices is observed.
Introduction • Observation rules • If a vertex is incident to a total of k >1 edges and k-1 of these edges are observed, then all k of these edges are observed.
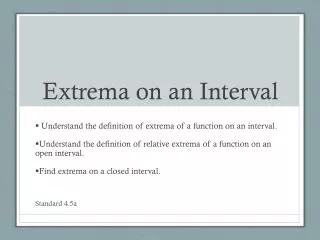
Introduction • Interval graph • A graph G is an interval graph if there exists a 1-1 mapping between its vertex set and a family of intervals on the real line s.t. two vertices in G are adjacent if and only if their corresponding intervals overlay.
Introduction • Probe interval graph (PIG) A graph G=(P+N,E) is a probe interval graph if the vertex set can be partitioned into two subsets P and N, the probe set P and the nonprobe set N, where N is an independent set.
Introduction • Properties of PIGs • PIGs contain interval graphs as a subclass. An interval graph G=(P,E) is also a probe interval graph. • PIGs are not chordal since they contain C4.
Introduction • PIGs are weakly chordal.A graph G is weakly chordal if G and contains no induced cycle Ck, k>4.
Previous results • Power domination
Previous results Weakly Chordal NP-c/ NP-c Chordal PIG P/? NP-c/NP-c Interval O(n)/ O(n) [2]
Reference • T.W. Haynes, S. M. Hedetniemi, S. T. Hedetniemi, and M. A. Henning, Domination in graphs applied to electric power network, SIAM J. Discrete Math. Vol. 15, No. 4, 2002, 519-529. • C. S. Liao and D. T. Lee, Power domination problem in graphs, Manuscript, 2003. • J. Guo, R. Niedermeier, and D, Raible, Improved algorithms and complexity results for power domination in graphs,Lecture Notes in Computer Science (LNCS), 3623:172--184, Springer-Verlag 2005. • Y. Y. Chien, Power domination on graphs, Master thesis, 2004.