Download
1 / 1
10 likes | 91 Views
CATG. CATG. CATG. CATG. CATG. CATG. CATG. SAGE

E N D
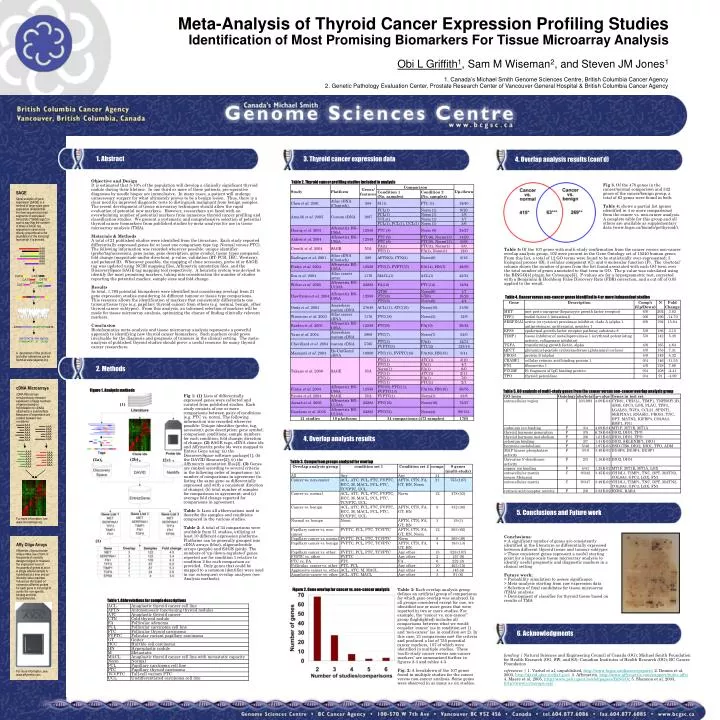
CATG CATG CATG CATG CATG CATG CATG SAGE Serial analysis of gene expression (SAGE) is a method of large-scale gene expression analysis.that involves sequencing small segments of expressed transcripts ("SAGE tags") in such a way that the number of times a SAGE tag sequence is observed is directly proportional to the abundance of the transcript from which it is derived. A description of the protocol and other references can be found at www.sagenet.org. AAA AAA AAA AAA AAA AAA AAA AAA AAA AAA AAA AAA AAA …CATGGATCGTATTAATATTCTTAACATG… GATCGTATTA 1843 Eig71Ed TTAAGAATAT 33 CG7224 cDNA Microarrays cDNA Microarrays simultaneously measure expression of large numbers of genes based on hybridization to cDNAs attached to a solid surface. Measures of expression are relative between two conditions. For more information, see www.microarrays.org. AAA AAA AAA AAA AAA AAA AAA AAA AAA AAA AAA AAA AAA AAA AAA AAA AAA AAA AAA AAA Affy Oligo Arrays Affymetrix oligonucleotide arrays make use of tens of thousands of carefully designed oligos to measure the expression level of thousands of genes at once. A single labeled sample is hybridized at a time and an intensity value reported. Values are the based on numerous different probes for each gene or transcript to control for non-specific binding and chip inconsistencies. Meta-Analysis of Thyroid Cancer Expression Profiling Studies Identification of Most Promising Biomarkers For Tissue Microarray Analysis Obi L Griffith1, Sam M Wiseman2, and Steven JM Jones1 1. Canada’s Michael Smith Genome Sciences Centre, British Columbia Cancer Agency 2. Genetic Pathology Evaluation Center, Prostate Research Center of Vancouver General Hospital & British Columbia Cancer Agency 1. Abstract 3. Thyroid cancer expression data 4. Overlap analysis results (cont’d) Objective and Design It is estimated that 5-10% of the population will develop a clinically significant thyroid nodule during their lifetime. In one third or more of these patients, pre-operative diagnoses by needle biopsy are inconclusive. In many cases, a patient will undergo unnecessary surgery for what ultimately proves to be a benign lesion. Thus, there is a clear need for improved diagnostic tests to distinguish malignant from benign samples. The recent development of tissue microarray techniques should allow the rapid evaluation of potential new markers. However, researchers are faced with an overwhelming number of potential markers from numerous thyroid cancer profiling and classification studies. We present a systematic and comprehensive selection of potential thyroid cancer biomarkers from published studies by meta-analysis for use in tissue microarray analysis (TMA). Materials & Methods A total of 21 published studies were identified from the literature. Each study reported differentially expressed genes for at least one comparison type (eg. Normal versus PTC). The following information was recorded wherever possible: unique identifier (probe/tag/accession), gene name, gene description, gene symbol, tissue types compared, fold change (magnitude and/or direction), p-value, validation (RT-PCR, IHC, Western), and pubmed ID. Whenever possible, the mapping of clone accession, probe id or SAGE tag was updated using NCBI mapping files, Affymetrix annotation files, and the DiscoverySpace SAGE tag mapping tool respectively. A heuristic system was devised to identify the most promising markers, taking into consideration the number of studies reporting the potential marker, sample sizes and fold-change. Results In total, 1,785 potential biomarkers were identified (not considering overlap) from 21 gene expression studies considering 34 different tumour or tissue type comparisons. This resource allows the identification of markers that consistently differentiate one tumour/tissue type (e.g. papillary thyroid cancer) from others (e.g. normal, benign, other thyroid cancer subtypes). From this analysis, an informed selection of markers will be made for tissue microarray analysis, optimizing the chance of finding clinically relevant markers. Conclusion Bioinformatics meta-analysis and tissue microarray analysis represents a powerful approach to identifying new thyroid cancer biomarkers. Such markers could prove invaluable for the diagnosis and prognosis of tumours in the clinical setting. The meta-analysis of published thyroid studies should prove a useful resource for many thyroid cancer researchers. Table 2. Thyroid cancer profiling studies included in analysis Fig 3. Of the 478 genes in the cancer/normal comparison and 332 genes of the cancer/benign group, a total of 63 genes were found in both. Table 4: shows a partial list (genes identified in 4 or more comparisons) from the cancer vs. non-cancer analysis. A complete table for this group and all others are available as supplementary data (www.bcgsc.ca/bioinfo/ge/thyroid/). Table 5: Of the 107 genes with multi-study confirmation from the cancer versus non-cancer overlap analysis group, 102 were present in the Gene Ontology set of 15240 human genes. From this list, a total of 12 GO terms were found to be statistically over-represented: 3 biological process (B); 3 cellular component (C); and 6 molecular function (F). The ‘obs/total’ column shows the number of genes from the list found associated with each GO term over the total number of genes annotated to that term in GO. The p-value was calculated using the BINGO[4] plugin for Cytoscape[5]. P-values are for a hypergeometric test, corrected with a Benjamini & Hochberg False Discovery Rate (FDR) correction, and a cut off of 0.05 applied to the result. Table 4. Cancer versus non-cancer genes identified in 4 or more independent studies 2. Methods Figure 1. Analysis methods Table 5. GO analysis of multi-study genes from the cancer versus non-cancer overlap analysis group Fig 1: (1) Lists of differentially expressed genes were collected and curated from published studies. Each study consists of one or more comparisons between pairs of conditions (e.g. PTC vs. norm). The following information was recorded wherever possible: Unique identifier (probe, tag, accession); gene description; gene symbol; comparison conditions; sample numbers for each condition; fold change; direction of change. (2) SAGE tags, cDNA clone ids and Affymetrix probe ids were mapped to Entrez Gene using: (a) the DiscoverySpace software package[1]; (b) the DAVID Resource[2]; (c) the Affymetrix annotation files[3]. (3)Genes are ranked according to several criteria in the following order of importance: (a) number of comparisons in agreement (ie. listing the same gene as differentially expressed and with a consistent direction of change); (b) total number of samples for comparisons in agreement; and (c) average fold change reported for comparisons in agreement. Table 1: Lists all abbreviations used to describe the samples and conditions compared in the various studies. Table 2: A total of 34 comparisons were available from 21 studies, utilizing at least 10 different expression platforms. Platforms can be generally grouped into cDNA arrays (blue), oligonucleotide arrays (purple) and SAGE (pink). The numbers of ‘up-/down-regulated’ genes reported are for condition 1 relative to condition 2 for each comparison as provided. Only genes that could be mapped to a common identifier were used in our subsequent overlap analyses (see Analysis methods). (1) 4. Overlap analysis results 9 (2b) (2a) (2c) Table 3. Comparison groups analyzed for overlap 5. Conclusions and Future work Conclusions: > A significant number of genes are consistently identified in the literature as differentially expressed between different thyroid tissue and tumour subtypes > These consistent genes represent a useful starting point for a large-scale tissue microarray analysis to identify useful prognostic and diagnostic markers in a clinical setting Future work: > Probability simulation to assess significance > Meta-analysis starting from raw expression data > Selection of final candidates for tissue microarray (TMA) analysis > Development of classifier for thyroid tissue based on results of TMA (3) Figure 2. Gene overlap for cancer vs. non-cancer analysis Table 3: Each overlap analysis group defines an artificial group of comparisons for which gene overlap was analyzed. In all groups considered except for one, we identified one or more genes that were reported in two or more studies. For example, the “cancer vs. non-cancer” group (highlighted) includes all comparisons between what we would consider ‘cancer’ (as in condition set 1) and ‘non-cancer’ (as in condition set 2). In this case, 21 comparisons met the criteria and produced a list of 755 potential cancer markers, 107 of which were identified in multiple studies. These ‘multi-study cancer versus non-cancer markers’ are summarized further in figures 2-3 and tables 4-5. Fig. 2: A breakdown of the 107 genes found in multiple studies for the cancer versus non-cancer analysis. Some genes were observed in as many as six studies. Table 1. Abbreviations for sample descriptions 6. Acknowledgments funding | Natural Sciences and Engineering Council of Canada (OG); Michael Smith Foundation for Health Research (OG, SW, and SJ); Canadian Institutes of Health Research (OG); BC Cancer Foundation references | 1. Varhol et al, unpublished, http://www.bcgsc.ca/discoveryspace/; 2. Dennis et al. 2003, http://david.abcc.ncifcrf.gov/; 3. Affymetrix, http://www.affymetrix.com/support/index.affx; 4. Maere et al. 2005, http://www.psb.ugent.be/cbd/papers/BiNGO/; 5. Shannon et al. 2003, http://www.cytoscape.org/ For more information, see www.affymetrix.com.