Download

1 / 34
520 likes | 978 Views
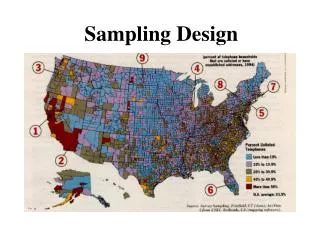
Sampling Design. Sampling Terminology. Sample A subset, or some part, of a larger population Population or universe Any complete group of entities that share some common set of characteristics Population element An individual member of a population Census

E N D
Sampling Terminology • Sample • A subset, or some part, of a larger population • Population or universe • Any complete group of entities that share some common set of characteristics • Population element • An individual member of a population • Census • An investigation of ALL the individual elements that make up a population
A puzzle is a sample until it’s done.The sample allows one to guess at the picture.
Why Sample? • Pragmatic Reasons • Budget & time constraints. • Limited access to total population. • Accurate and Reliable Results • Samples can yield reasonably accurate information. • Strong similarities in population elements makes sampling possible. • Sampling may be more accurate than a census. • Destruction of Test Units • Sampling reduces the costs of research in finite populations.
Table 12.1 Sample Versus Census Sample vs. Census
Identifying a Relevant Population • Defining the Target Population • What is the relevant population? • Whom do we want to talk to? • Population is operationally defined by specific & explicit tangible characteristics. • If you want to target “Women”, do you mean • All women still capable of bearing children or, • All women between the ages of 12 and 50?
Identifying a Sampling Frame • A list of elements from which a sample may be drawn • Also called the working population. • Sampling Frame Error occurs when certain sample elements • are not listed, or • are not accurately represented in a sampling frame. • Sampling services (list brokers) • Provide lists or databases of the names, addresses, phone numbers, & e-mail addresses of specific populations. • Reverse directory • A directory similar to a telephone directory except that listings are by city & street address or by phone number rather than alphabetical by last name. • Online Panels • Lists of respondents who have agreed to participate in marketing research via e-mail. • International Research • Availability of sampling frames varies dramatically around the world.
Sampling Units • Sampling Unit • A single element or group of elements subject to selection in the sample. • Primary Sampling Unit (PSU) • A unit selected in the first stage of sampling. • Secondary Sampling Unit • A unit selected in the second stage of sampling. • Tertiary Sampling Unit • A unit selected in the third stage of sampling.
Random Sampling & Nonsampling Errors • Random Sampling Error • The difference between the sample result & the result of a census conducted using identical procedures. • A statistical fluctuation that occurs because of chance variations in the elements selected for a sample. • Probability of such error increases as sample size decreases. • Systematic Sampling Error • Systematic (nonsampling) error results from nonsampling factors, primarily the nature of a study’s design & the correctness of execution. • It is not due to chance fluctuation. • Probability of such error increases as sample size increases.
Two Major Categories of Sampling • Probability sampling • Known, nonzero, & equal probability of selection for every population element • Nonprobability sampling • Probability of selecting any particular member is unknown
Nonprobability Sampling • Convenience Sampling • Obtaining people or units that are most conveniently available. • Judgment (Purposive) Sampling • Experienced individual selects sample based on personal judgment about some appropriate characteristic of the sample member. • Quota Sampling • Ensures that various subgroups of a population will be represented on pertinent characteristics to the exact extent that the investigator desires. • Snowball Sampling • A sampling procedure in which initial respondents are selected by probability methods and additional respondents are obtained from information provided by the initial respondents.
Most Commonly-Used Probability Sampling Techniques Figure 12.8 Probability Sampling Techniques Probability Sampling Techniques Simple Random Sampling Systematic Sampling Stratified Sampling Proportional vs. Disproportional Sampling Cluster Sampling
Probability Sampling • Simple Random Sampling • Assures each element in the population of an equal chance of being included in the sample. • Systematic Sampling • A starting point is selected by a random process and then every nth number on the list is selected. • Stratified Sampling • Simple random subsamples that are more or less equal on some characteristic are drawn from within each stratum of the population.
Proportional vs. Disproportional Sampling • Proportional Stratified Sample • Number of sampling units drawn from each stratum is in proportion to population size of that stratum. • Disproportional Stratified Sample • Sample size for each stratum is allocated according to analytical considerations.
Cluster Sampling • Economically efficient sampling technique in which primary sampling unit is not the individual element in the population but a large cluster of elements. • Clusters are selected randomly.
What is the Appropriate Sample Design?It Depends • Degree of accuracy • Resources • Time • Advanced knowledge of the population • National versus local • Need for statistical analysis
Internet Samples • Recruited Ad Hoc Samples • Potential subjects unaware they might be asked to participate in a study • Less expensive • Lower selection bias • Opt-in Lists • Potential subjects know they might be asked to participate in studies as they have previously agreed to receive such invitations. • More expensive • Greater chance of selection bias • “Much Better” response rates (????)
Sample SizeBigger Is Better — Right? • One study indicates that 60% of consumers believe that there is too much violence in video games, but another study suggests that 75% of parents do not believe it harms children. • Another shows that 40% of Nintendo owners are highly likely to buy a new game that has been concept tested. • How good are these descriptive statistics? Consider the sample!
Information Needed to Determine Sample Size • Variance (standard deviation) • A heterogeneous population has more variance (a larger standard deviation) which will require a larger sample. • A homogeneous population has less variance (a smaller standard deviation) which permits a smaller sample. • Get from pilot study or rule of thumb (managerial judgment) • Magnitude of error • How precise must the estimate be? • Managerial judgment or calculation • Confidence level • How much error will be tolerated? • Managerial judgment • Most commonly used standards are a 95% confidence level (Z score = 1.96), or 99% confidence level (Z score = 2.57).
Sample Size Formula for Questions Involving an Analysis of Means
Sample Size Formula - Example Suppose a survey researcher is studying expenditures on lipstick Wishes to have a 95 percent confident level (Z) and Range of error (E) of less than $2.00. The estimate of the standard deviation is $29.00.
Sample Size Formula - Example Suppose, in the same example as the one before, the range of error (E) is acceptable at $4.00 (rather than the original $2.00), sample size is reduced.
Calculating Sample Size 2 2 é ù é ù ( 2 . 57 )( 29 ) ( 2 . 57 )( 29 ) = = n n ê ú ê ú 4 2 ë û ë û 2 2 é ù é ù 74 . 53 74 . 53 = = ê ú ê ú 4 2 ë û ë û ] [ [ ] 2 2 = = 6325 18 . 37 . 265 = = 347 1389 99% Confidence
Sample Size for a Proportion:Example • A researcher believes that a simple random sample will show that 60 percent of a population (p = .6) recognizes the name of an automobile dealership. • Note that 40% of the population would not recognize the dealership’s name (q = .4) • The researcher wants to estimate with 95% confidence (Z = 1.96) that the allowance for sampling error is not greater than 3.5 percentage points (E = 0.035)
Calculating Sample Size at the 95% Confidence Level = p . 6 2 ( 96 )(. 1. ) (. 6 4 ) = n = ( . 035 ) 2 q . 4 ( 3 . 8416 )(. 24 ) = 001225 . 922 = . 001225 = 753