Download
1 / 34
340 likes | 472 Views
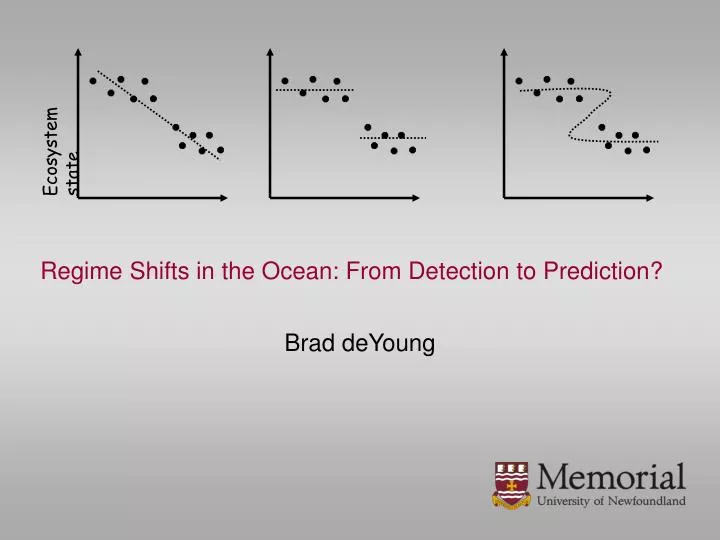
Ecosystem state. Regime Shifts in the Ocean: From Detection to Prediction?. Brad deYoung. DEFINITION OF THE REGIME SHIFT. Working definition : a regime shift is a relatively abrupt change between contrasting persistent states in an ecosystem. Erosion of resilience. Environmental state.

E N D
Ecosystem state Regime Shifts in the Ocean: From Detection to Prediction? Brad deYoung
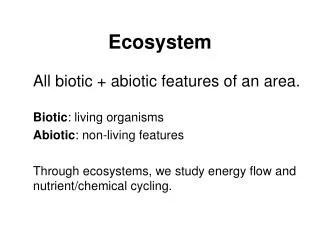
DEFINITION OF THE REGIME SHIFT Working definition : a regime shift is a relatively abrupt change between contrasting persistent states in an ecosystem
Erosion of resilience Environmental state Erosion of resilience Environmental driver
Review of a few examples • Scotian Shelf – driven primarily by fishing, cascading trophic impacts • North Sea – combined drivers: natural=biogeographic shift and human=fishing • North Pacific – complex natural state change(s) • Coral reef systems – driven by human action by ‘tipped’ by natural driver Explore characteristics of the drivers and response of differing examples – time and space scales, trophic structure, predictability
-30% +30% Scotian Shelf – Frank et al. 2005
Colour display of 60+ indices for Eastern Scotian Shelf Grey seals, pelagic fish abundance, invertebrate landings, fish species richness, phytoplankton Grey seals - adults Pelagic fish - #’s Pelagic:demersal #’s Pelagic:demersal wt. Inverts - $$Pelagics - wtDiatoms Grey seals – pups Pelagics - $$ Greenness Dinoflagellates Fish diversity – richness 3D Seisimic (km2) Gulf Stream position Stratification anomaly Diatom:dinoflagellate Sea level anomaly Volume of CIL source water Inverts – landings Bottom water < 3 C Sable winds (Tau) SST anomaly (satellites) chlorophyll – CPR Temperature of mixed layer NAO Bottom T – Emerald basin Copepods – Para/Pseudocal Shelf-slope front position Storms Bottom T – Misaine bank Groundfish landings Haddock – length at age 6 Bottom area trawled (>150 GRT) Cod – length at age 6 Average weight of fish Community similarity index PCB’s in seal blubber Relative F Pollock – length at age 6 Calanus finmarchicus Groundfish biomass – RV Pelagics – landings Silver hake – length at age Condition – KF Depth of mixed layer Condition – JC Proportion of area – condition RIVSUM Sigma-t in mixed layer Oxygen Wind stress (total) Wind stress (x-direction) Wind stress amplitude SST at Halifax Groundfish - $$ Salinity in mixed layer Ice coverage Wind stress (Tau) Number of oil&gas wells drilled Nitrate Groundfish fish - #’s Shannon diversity index –fish Seismic 2D (km) Red – below average Green – above average Bottom temp., exploitation, groundfish biomass & landings, growth-CHP, avg. fish weight, copepods 1970 1975 1980 1985 1990 1995 2000
Top Predators (Piscivores) + Forage (fish+inverts) (Plankti-,Detriti-vores) - Zooplankton (Herbivores) + Phytoplankton (Nutrivores) -
Physical forcing – air temperature - but there are dozens, and dozens of other such time series
North Sea regime shift – a mixture of biogeography, environmental change and fishing Line in black: warm-temperate species Line in red: temperate species 12 5 11 4.5 M O N T H S 10 4 9 8 3.5 7 3 6 2.5 5 2 4 1.5 3 2 1 1 58 62 66 70 74 78 82 86 90 94 98 Years Mean number of calanoid species per CPR sample Before 1980 After 1980
Gadoid species (cod) Flatfish plankton change plankton change salinity SST NHT anomalies Westerly wind
Beaugrand & Ibanez (in press, MEPS) Beaugrand G (2004) Progress in Oceanography
Beaugrand & Ibanez (in press, MEPS) Beaugrand G (2004) Progress in Oceanography
Long-term changes in the abundance of two key species in the North Sea Percentage of C. helgolandicus Reid et al. (2003)
Consequences of plankton changes on higher trophic level Abundance of C. finmarchicus Abundance of C. helgolandicus Mismatch between the timing of calanus prey and larval cod Beaugrand, et al. (2003) Nature. Vol. 426. 661-664.
But there is also a significant influence of fishing – how much??
North Sea - dynamics Ocean circulation Biogeographic shift Meteorological/oceanographic forcing Fishing Ecosystem status and function Ocean conditions
Loss of resilience Overfishing Nutrient loading Healthy state Parasite infection Stressed state Sea urchin collapse Rock
Natural and anthopogenic Climate Pelagic -P Demersal P Pelagic -NWA Demersal-NWA Coral system Biology Habitat Natural and anthopogenic Natural and anthopogenic Ecosystem drivers
Prediction Coral Demersal -NWA Demersal - P Pelagic NWA Detection Pelagic -P Management Ecosystem response
How predictable are regime shifts? Should differentiate prediction of the drivers and the response. • Simulation of the environmental, met and ocean, drivers seems possible in a number of cases. How to develop the transfer function to the response? Possibly without use of a numerical model • Diagnostic calculation – in which one uses key data to drive an ecosystem model, perhaps a mix of biological and physical data • Full integrated biophysical simulation – purely deterministic??
Nemuro Pacific herring model Time series output Zooplankton and temperature time series COCO – Toykyo 3-D Nemuro Observations- Biological and Physical Validation NCEP 6 hourly data 1948-2002 (includes interannual variability)
WCVI Herring growth rate (age 3 to 4) Temperature Small zooplankton Large zooplankton Predatory zooplankton Rose et al. (2005), submitted to EM.
Long-term change in the plankton index and cod recruitment (at age 1, one-year lag) Beaugrand et al. (2003) Nature. Vol. 426. 661-664.
warming of temperature (-) (+) Larval metabolism Decrease in the number of prey (-) (+) (-) (+) Energetic demand Energetic gain Energetic imbalance (-) Growth and survival (-) Overfishing Reduction in recruitment