Download
1 / 33
330 likes | 420 Views
P 2 : Proficiency & Progress 2011. Dr. Ron Costello Superintendent of Catholic Schools Archdiocese of Indianapolis rcostello@archindy.org Phone: 317-236-1486. Using Data to Think & Do Things Differently. 1.

E N D
P2: Proficiency & Progress 2011 Dr. Ron Costello Superintendent of Catholic Schools Archdiocese of Indianapolis rcostello@archindy.org Phone: 317-236-1486 Using Data to Think & Do Things Differently 1
“When you start looking at reform, I think the pressure on school systems actually has been advantageous--but only to point. It’s been a wake-up call but not enough people are out of bed yet.” -- Dr. Michael Fullan
Continuous School Improvement and Assessment Literacy • Capacity to examine student data and make sense of it. • Ability to make changes in teaching and schools derived from those data. • Commitment to engage in external assessment discussions.Michael Fullan
Presentation Goals What we want to do today is: • Introduce you to the Archdiocesan Performance Report – Data Analysis • Convince using to use data to support your case for your school. This is a must in this era of school accountability (impact of vouchers); and, • Make you aware of the data that is already available to the public about your Catholic school.
Faith Dimension/Catholic Identity Results of the parents survey concerning a school’s Catholic identity. Results indicate support parents have for the mission of your school. Schools should use the results in their annual performance report. The information is included in PILLARS.
Indiana Department of EducationDetermining AYP • Initial goal (starting point- 2002, 2003, and 2004 tests) • English – 58.8% Math – 57.1% • 2005, 2006, and 2007 tests (for three years) • English – 65.7% Math – 64.3% • 2008, 2009, and 2010 tests (for three years) • English – 72.6% Math – 71.5% • Intermediate goals at equal increments for: • 2011 test • English – 79.5% Math – 78.7% • 2012 test • English – 86.4% Math – 85.9% • 2013 test • English – 93.3% Math – 93.1% • All students (100%) are expected to be at “proficient” or “Pass” level on 2014 test (data for 2013-2014 school year)
Indiana School Improvement & Performance Categories for Schools Not Meeting AYP Goals Performance Exemplary Progress Commendable Progress Academic Progress Academic Watch (Priority) Academic Probation (High Priority) ≥90% Exemplary School ≥80% ≥1% Commendable School ≥70% ≥3% ≥2% ≥1% <1% ≥60% ≥4% ≥3% ≥2% <2% ≥50% ≥5% ≥4% ≥3% ≥0% <0% ≥40% ≥6% ≥5% ≥4% ≥1% <1% <40% ≥6% ≥5% ≥3% <3% Improvement from Fall to Fall
What is a Value-AddedProgress Metric? Battelle – “Toolkit for School Leaders”
Why Value-Added? - Measuring Are both student making appropriate academic growth? Battelle – “Toolkit for School Leaders”
Assessment Error – Bill Sanders Same data without 2 lowest scores … Simple Analysis with complete data …
Value-Added Test Properties Tests must: Be highly correlated to curricular objectives Have sufficient stretch Have appropriate levels reliability Battelle – “Toolkit for School Leaders” 21
Value-Added Assessment All students deserve the opportunity to achieve Less than a year’s progress puts at student risk Growth can be measured and reported on an annual basisWilliam Sanders 1996 22
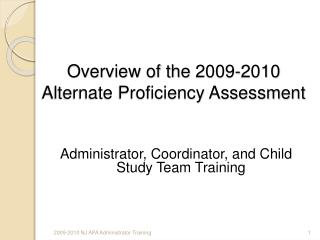
Possible School Outcomes Pr o f i c i ency High Proficiency Low Growth High Proficiency High Growth Low Proficiency Low Growth Low Proficiency High Growth Growth Theodore Hershberg Value-Added Assessment and Systemic Reform, PDK, Dec. 2005
Based upon formula from Scott Gillie: Graduation Rate X Percent Pursuing College = Chance for College
Improving Catholic School Vitality - ACT Catholic Identity Total school – Advancement and Development Effort Academics
For additional school information Contact: Dr. Ron Costello or Kathy Mears Name: Office of Catholic Education School: Archdiocese of Indianapolis Address: 1400 N. Meridian Street City, State, Zip: Indianapolis, IN 46202 Phone: 317-236-1430 email: rcostello@archindy.org kmears@archindy.org